













Taksar Pikhuwa Khola Hydropower Limited – First Quarter Analysis, FY 2083/84
Unaudited results as on Ashwin end 2083, compared with the same quarter last year (Ashwin end 2082) and with Ashad end 2083.
Summary
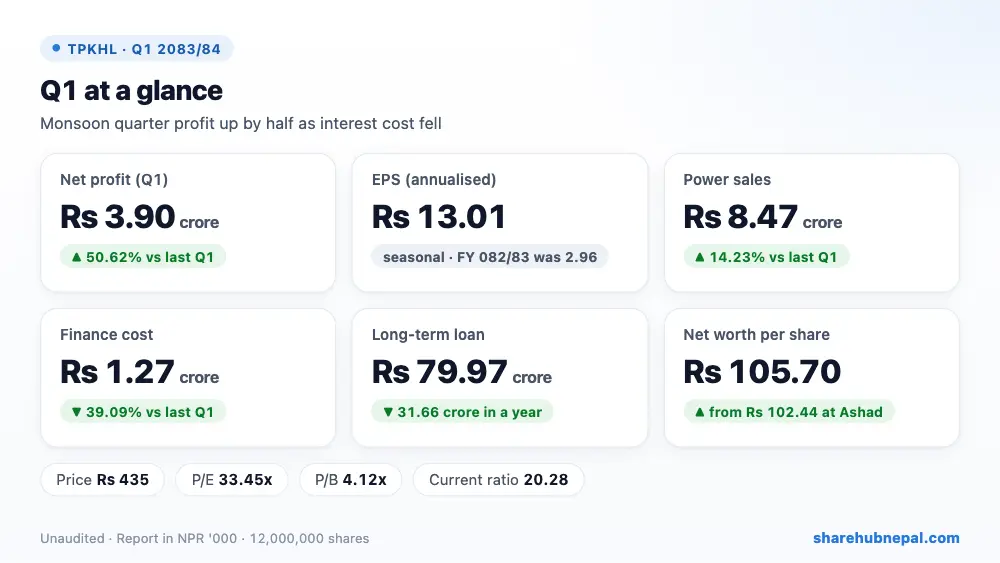
Taksar Pikhuwa Khola Hydropower, which runs the Pikhuwa Khola project (in commercial operation since 1 Baisakh 2078), earned a net profit of Rs 3.90 crore in the first quarter, up 50.62% from Rs 2.59 crore a year ago. Annualised EPS is Rs 13.01 on 12,000,000 shares. This one monsoon quarter earned more than the whole of last year (Rs 3.56 crore).
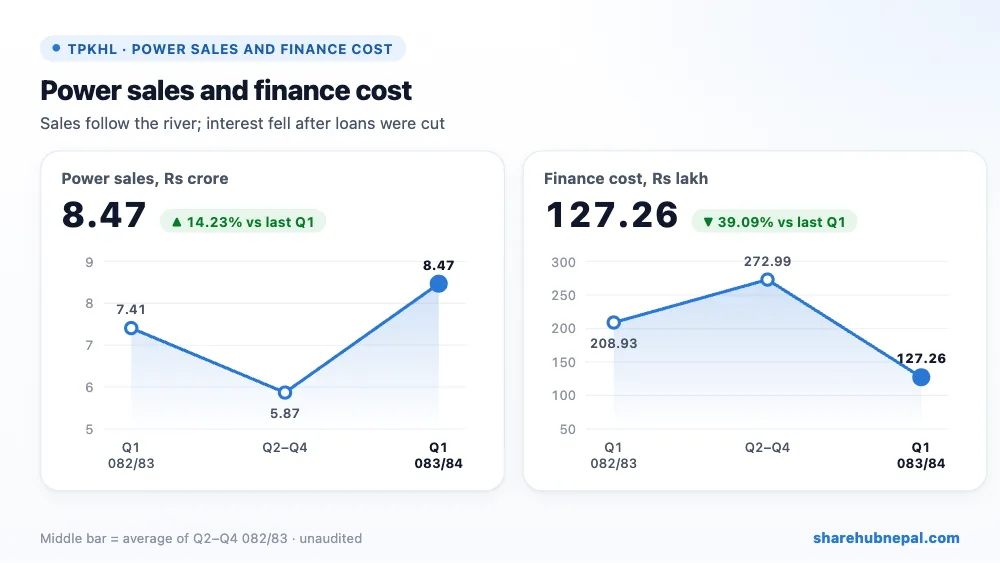
Power sales rose 14.23% to Rs 8.47 crore. The bigger help came from interest: finance cost fell 39.09% to Rs 1.27 crore because the company raised share capital from Rs 77.69 crore to Rs 120 crore during the year and cut its loans. Direct and administrative costs rose about 41–42%, and a staff bonus provision of Rs 7.96 lakh was added. Net margin improved to 46.06% from 34.93%.
| Indicator | Q1 2083/84 | Q1 2082/83 | Change |
| Income from power sales | Rs 84,701,830 | Rs 74,149,230 | +14.23% |
| Direct expenses | Rs 4,099,640 | Rs 2,905,170 | +41.12% |
| Administrative and operating costs | Rs 10,648,010 | Rs 7,481,820 | +42.32% |
| Finance cost | Rs 12,726,380 | Rs 20,892,900 | −39.09% |
| Depreciation | Rs 17,414,650 | Rs 16,965,320 | +2.65% |
| Staff bonus provision | Rs 796,260 | – | – |
| Net profit | Rs 39,016,890 | Rs 25,904,020 | +50.62% |
| EPS (annualised) | 13.01 | 13.34 | – |
| Net profit margin | 46.06% | 34.93% | – |
1. Where the profit came from
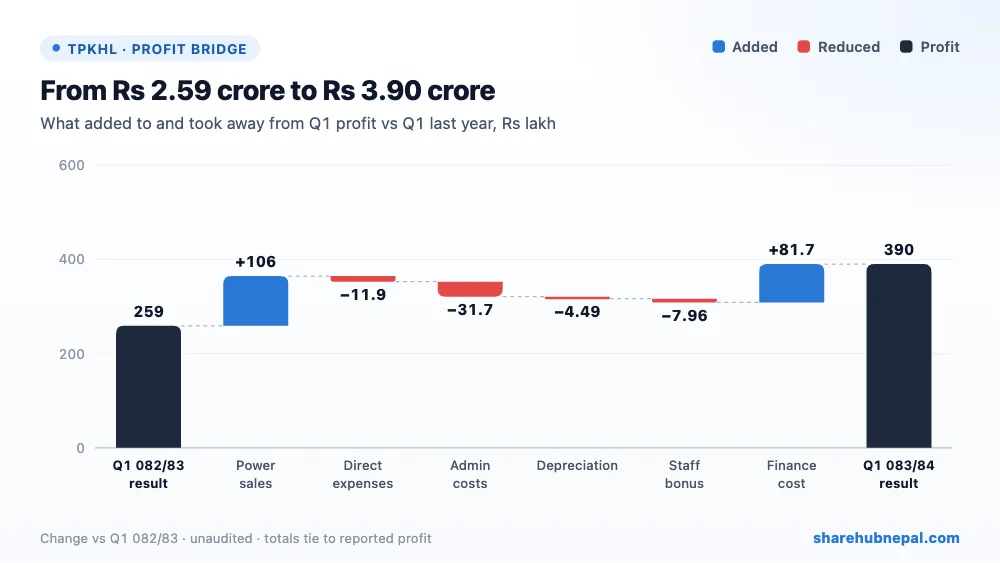
Compared with last year's Q1, higher power sales added Rs 1.06 crore and lower finance cost added Rs 81.67 lakh. Against that, higher administrative costs took away Rs 31.66 lakh, direct expenses Rs 11.94 lakh, the new staff bonus provision Rs 7.96 lakh and depreciation Rs 4.49 lakh. Net result: profit up Rs 1.31 crore.
2. Profit through the year
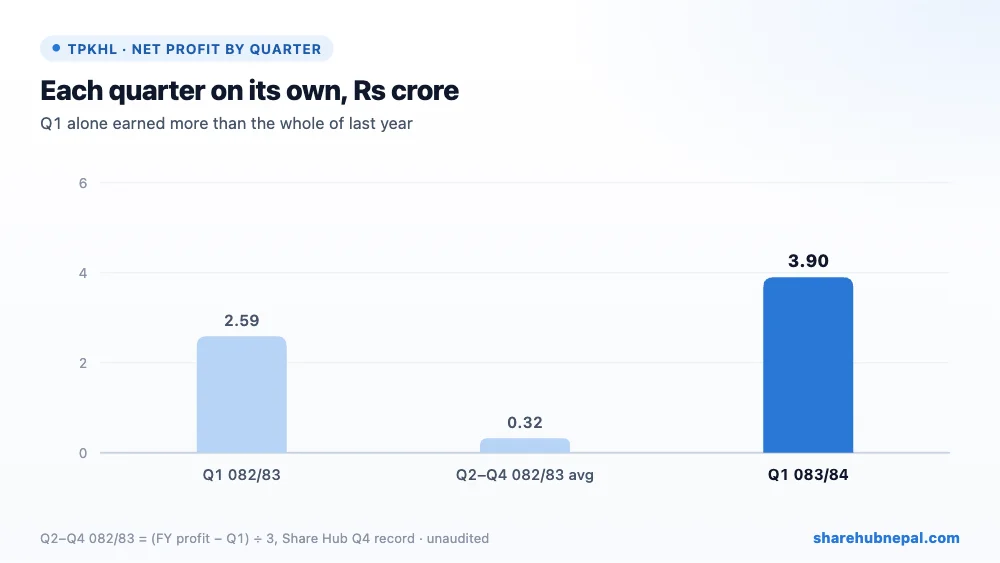
Share Hub has no Q2 or Q3 2082/83 record for TPKHL. Using the full-year profit of Rs 3.56 crore and last year's Q1 of Rs 2.59 crore, Q2–Q4 together earned only Rs 96.72 lakh (about Rs 32.24 lakh a quarter). Hydropower earns most in the wet months, so annualised EPS of Rs 13.01 will very likely be higher than the real full-year EPS.
3. Debt and balance sheet
| Particulars | Ashwin 2083 | Ashad 2083 | Change |
| Long-term loan | Rs 799,651,940 | Rs 805,312,950 | −0.70% |
| Short-term loan | Rs 10,487,190 | Rs 39,999,500 | −73.78% |
| Property, plant and equipment (net) | Rs 1,623,495,010 | Rs 1,639,569,930 | −0.98% |
| Current assets | Rs 467,551,700 | Rs 447,074,480 | +4.58% |
| Current liabilities | Rs 23,050,180 | Rs 52,003,760 | −55.68% |
| Total equity | Rs 1,268,344,590 | Rs 1,229,327,700 | +3.17% |
The long-term loan is Rs 79.97 crore, a little below Rs 80.53 crore at Ashad end and Rs 31.66 crore lower than a year ago; the short-term loan fell to Rs 1.05 crore from Rs 4.00 crore. Debt is now 0.63 times equity. Current assets of Rs 46.76 crore (including Rs 21.06 crore of investments and Rs 5.53 crore due from NEA) are 20.28 times current liabilities. Equity rose to Rs 126.83 crore, exactly by the quarter's profit.
4. Per-share figures and valuation
| Indicator | Value |
| EPS (annualised) | Rs 13.01 |
| Net worth per share | Rs 105.70 |
| Total assets per share | Rs 174.25 |
| Market price (report) | Rs 435.00 |
| P/E (report) | 33.45x |
| P/B | 4.12x |
| Current ratio | 20.28 |
At Rs 435 the share trades at 33.45 times annualised EPS and 4.12 times net worth per share. On last year's full-year EPS of Rs 2.96 the P/E would be about 147, so the price depends on the company keeping this better profit through the dry season.
Conclusion
Positives: profit up by half, much lower interest cost after the capital raise, falling loans (0.63x equity), very strong liquidity (current ratio 20.28) and no tax charge.
Watch: a seasonal Q1 that overstates annual EPS, admin and direct costs rising faster than sales, a high P/E on last year's earnings, and flood or landslide risk to the project noted by the company.
Taksar Pikhuwa had a strong first quarter, helped mostly by lower interest after it cut its loans. The real test is the dry season: watch Q2 and Q3 to see how much of this profit holds.
Figures are from the company's unaudited Q1 report; quarter trends use Share Hub records. This is not investment advice.

