













How to Read the NEPSE Floorsheet and Broker Analysis Like a Pro

Share Hub
October 23, 2026 03:52 AM
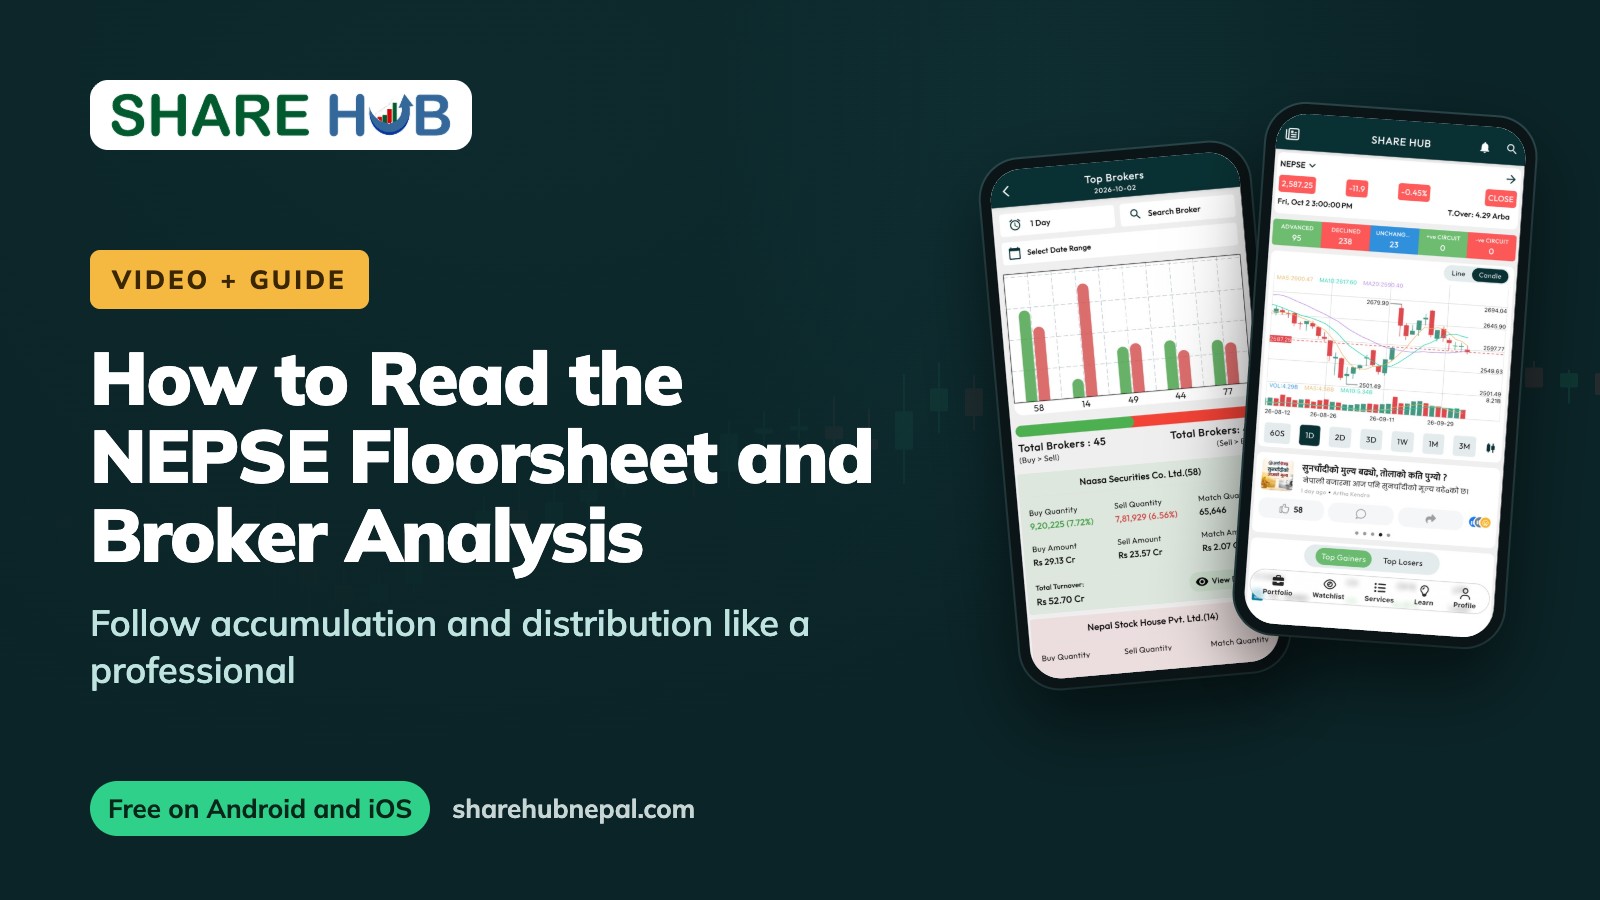
Prices tell you what happened. The floorsheet tells you who made it happen. Every executed trade on NEPSE is recorded with the buying broker, the selling broker, the quantity, the price and the time. Read carefully over several days, that record can show whether large players are quietly building positions or slowly heading for the exit.
This guide explains how to read the floorsheet, how to turn it into broker analysis, and how to avoid the most common mistakes traders make when they try to follow the smart money.
What is in the floorsheet
The floorsheet is the full list of trades for a day. Each row includes:
| Column | What it means |
|---|---|
| Symbol | The stock traded |
| Buyer | The broker number that bought, on behalf of its clients |
| Seller | The broker number that sold |
| Quantity | Number of shares in the trade |
| Price and amount | Rate per share and total value |
| Trade time and contract ID | When the trade happened and its unique reference |
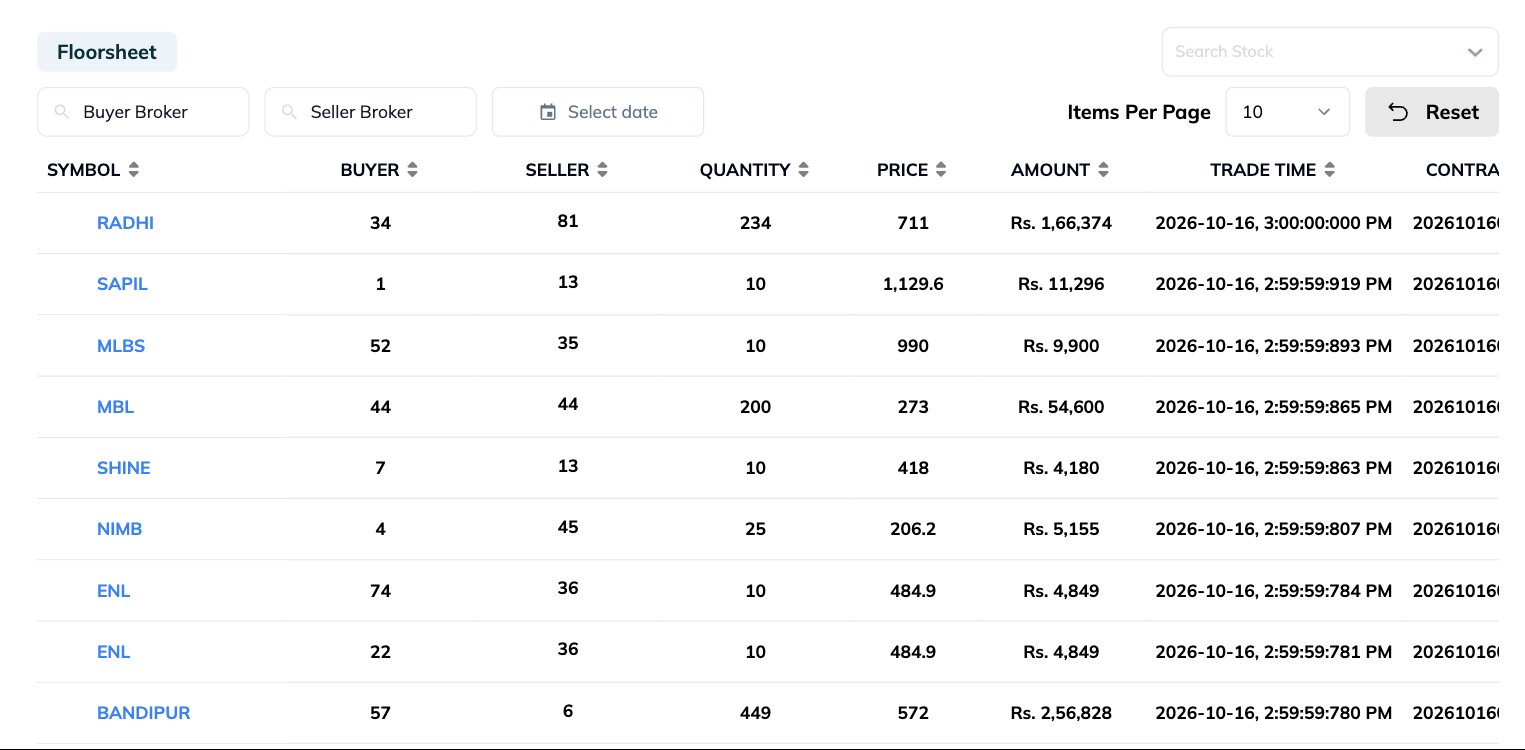
On its own, a single row means little. A broker might be buying for hundreds of different clients. The value comes from adding up activity across a stock, a broker and several days.
From floorsheet to broker analysis
Broker analysis aggregates the floorsheet so you can see, for each stock, which brokers bought the most, which sold the most, and the difference between the two.
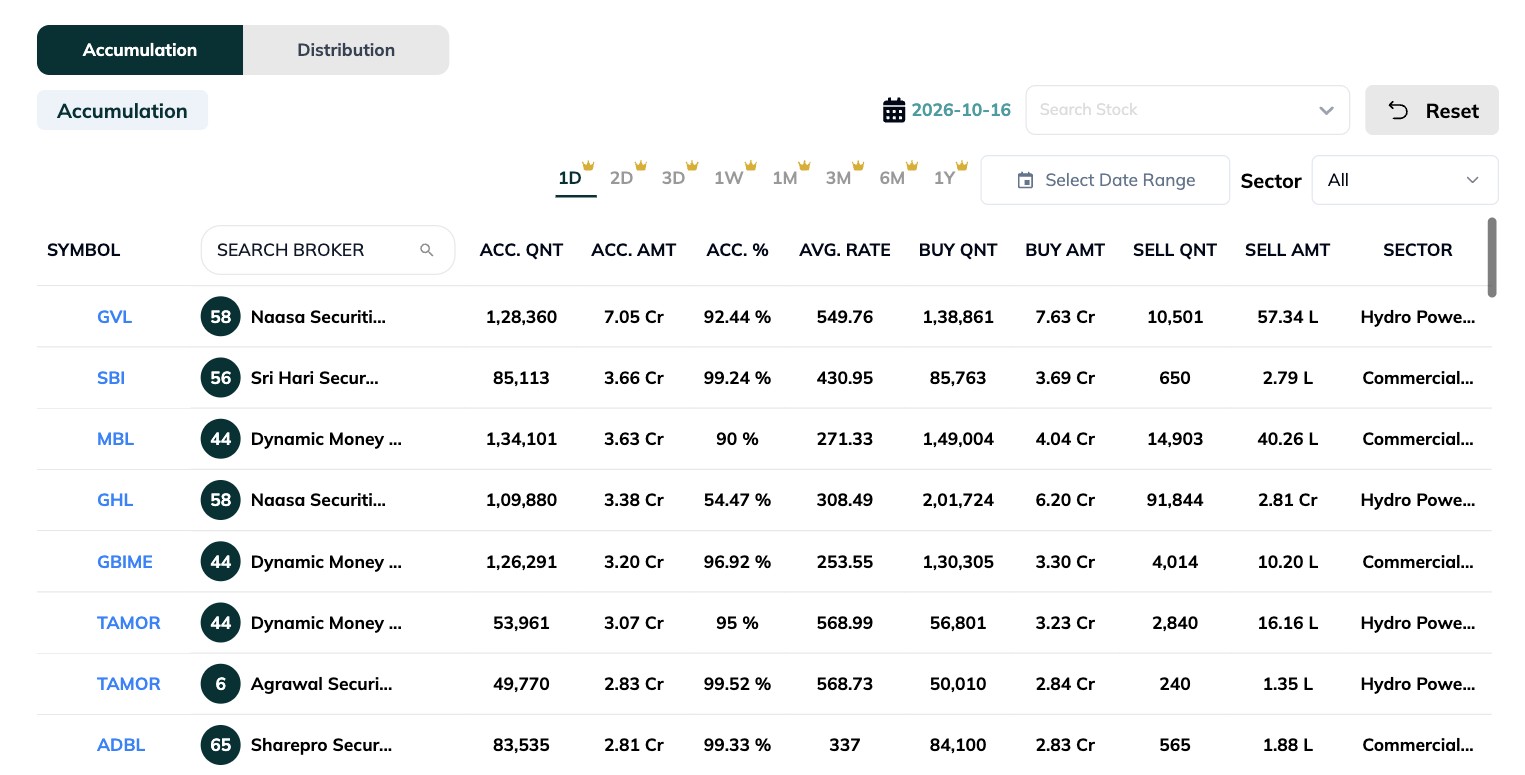
- Accumulation: a broker buys far more than it sells in a stock. Net buying concentrated in a few brokers can suggest a large investor building a position.
- Distribution: a broker sells far more than it buys. Persistent net selling, especially into rising prices, can suggest a large holder unloading.
How to read the accumulation table
Take a row where a broker bought 1,38,861 shares of a stock and sold 10,501 in a day. Its accumulated quantity is 1,28,360 shares, and the accumulation percentage is 1,28,360 divided by 1,38,861, or 92.44%. A very high percentage means the broker was almost entirely a buyer. The average rate tells you roughly where that buying happened, which often becomes a reference level for support.
Patterns worth watching
- Quiet accumulation: the same one or two brokers net buying for several sessions while the price moves sideways. This sometimes comes before a breakout.
- Distribution into strength: the price rises on high volume while a few brokers sell steadily. Rallies like this often fade.
- Volume without direction: heavy buying and selling by the same brokers with little net change can point to churning rather than genuine interest.
- Unlock-linked selling: steady selling around a promoter lock-in end date. See our guide to the SEBON sale-notice rule.
Common mistakes
- Treating a broker as one person. Each broker serves many clients. Large net buying might be many small investors, not one whale.
- Reading one day in isolation. Look at 5, 10 or 20 sessions to see whether a pattern is real.
- Ignoring price and volume. Broker activity is most useful when it agrees with the chart.
- Chasing after the move. By the time accumulation is obvious, much of the move may be done.
Watch: who really moves NEPSE?
This ShareHub video looks at the large players behind big moves in NEPSE, and how retail investors can think about them:
What is free and what is Premium
The full Floorsheet is free in ShareHub. The aggregated tools, including Broker Analysis, Accumulation and Distribution, Broker Favourites, Broker Aggregate Holdings and the Zero Sum Floorsheet view, are part of AD FREE + PREMIUM at Rs. 800 a year. Bulk market transactions and unusual trades are included in Trader's Zone.
Also in the app: The floorsheet, broker analysis and top broker screens is available in the ShareHub mobile app for Android and iOS, so you can do it from your phone as easily as from your computer.
Frequently asked questions
What is a floorsheet in NEPSE?
It is the complete daily record of executed trades, showing the stock, buying broker, selling broker, quantity, price and time of each trade.
What does broker accumulation mean?
It means a broker bought considerably more shares of a stock than it sold over a period, which can indicate building interest.
Is broker analysis reliable?
It is a useful clue, not proof. Combine it with price action, volume and fundamentals before acting.
Follow the money with better tools
See the full floorsheet for free, and unlock broker analysis with ShareHub Premium.
Open the floorsheetGet it on Google PlayDownload on the App Store