













Arun Valley Hydropower Development Co. Ltd – First Quarter Analysis, FY 2083/84
Unaudited results as on Ashwin end 2083, compared with the same quarter last year (Ashwin end 2082) and with Ashad end 2083.
Summary
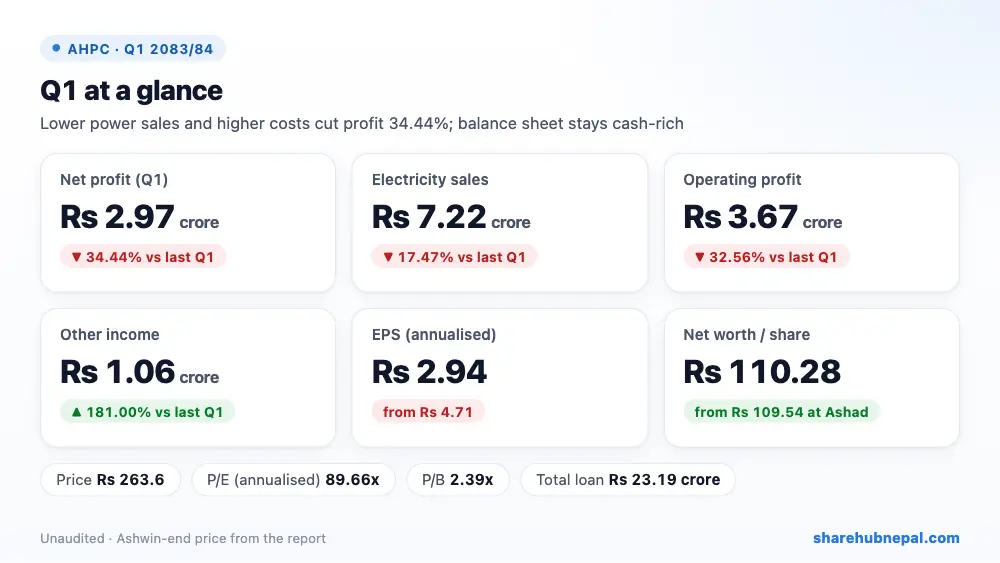
Arun Valley Hydropower earned a net profit of Rs 2.97 crore in the first quarter of FY 2083/84, down 34.44% from Rs 4.53 crore a year ago. Electricity sales from its Kabeli B-1 Cascade and Piluwa Khola plants fell 17.47% to Rs 7.22 crore while cost of sales nearly doubled to Rs 2.02 crore; the report does not explain either. Other income rose to Rs 1.06 crore, softening the fall. Annualised EPS is just Rs 2.94 on a large capital base of Rs 4.04 arba, and net worth per share is Rs 110.28. The company has almost no debt and about Rs 2 arba in cash, investments and other financial assets.
| Indicator | Q1 2083/84 | Q1 2082/83 | Change |
| Revenue from sales | Rs 72,219,624 | Rs 87,502,714 | −17.47% |
| Cost of sales | Rs 20,226,762 | Rs 10,829,712 | +86.77% |
| Other income | Rs 10,638,631 | Rs 3,785,981 | +181.00% |
| Operating profit | Rs 36,655,843 | Rs 54,353,485 | −32.56% |
| Finance cost | Rs 4,656,844 | Rs 6,341,165 | −26.56% |
| Income tax | Rs 1,910,370 | Rs 2,156,219 | −11.40% |
| Net profit | Rs 29,713,485 | Rs 45,323,282 | −34.44% |
| EPS (annualised) | 2.94 | 4.71 | – |
| Net worth per share | 110.28 | 113.05 | – |
1. Where the profit came from
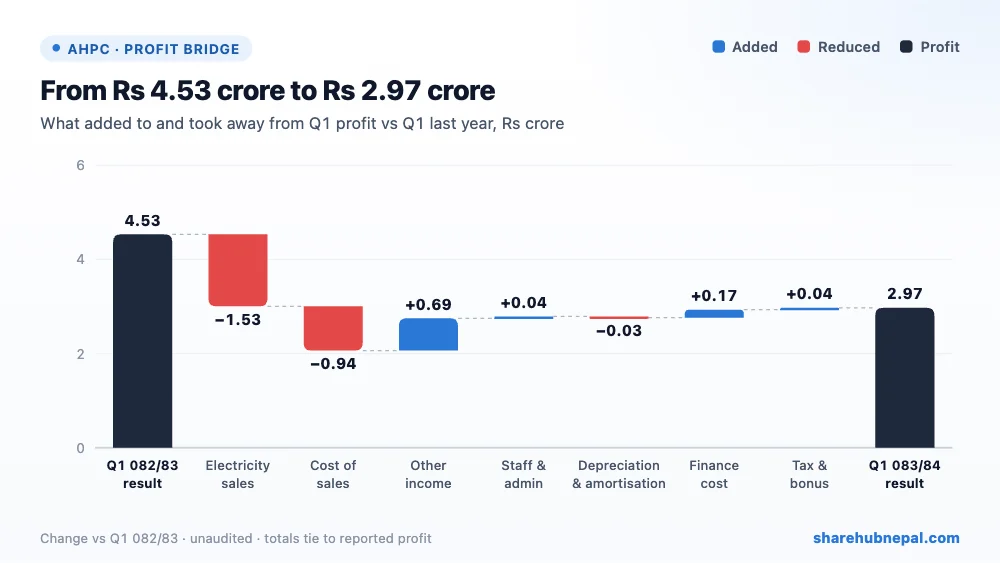
Sales fell by Rs 1.53 crore to Rs 7.22 crore and cost of sales rose to Rs 2.02 crore from Rs 1.08 crore, so gross profit dropped to Rs 5.20 crore from Rs 7.67 crore. Other income of Rs 1.06 crore (Rs 37.86 lakh) helped. Depreciation and amortisation stayed at Rs 2.45 crore and staff and admin costs were Rs 15.23 lakh, leaving operating profit of about Rs 3.67 crore (−32.56%). Finance cost fell to Rs 46.57 lakh. After bonus and CSR of Rs 3.75 lakh and tax of Rs 19.10 lakh, net profit was Rs 2.97 crore.
2. Profit through the year
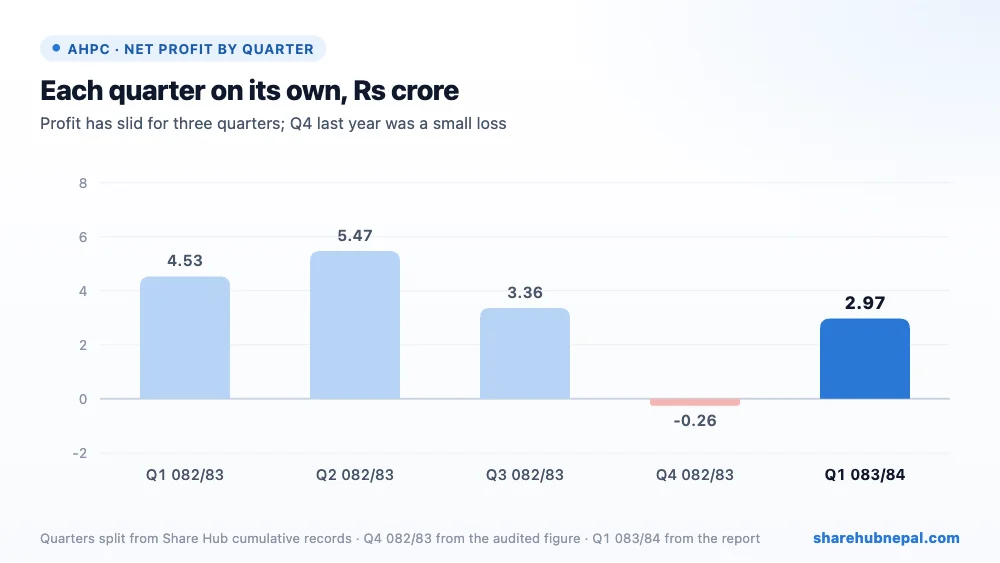
Profit by quarter (Share Hub cumulative records, split into quarters; Q4 from the audited FY figure in this report): Q1 082/83: Rs 4.53 crore, Q2 082/83: Rs 5.47 crore, Q3 082/83: Rs 3.36 crore, Q4 082/83: −Rs 25.91 lakh, Q1 083/84: Rs 2.97 crore. Profit has been sliding: after Rs 5.47 crore in Q2 last year it fell to Rs 3.36 crore in Q3 and a small loss in Q4 (per the audited full-year profit of Rs 13.11 crore). Share Hub's Q4 record shows Rs 13.79 crore for the year.
3. Debt and balance sheet
| Particulars | Ashwin 2083 | Ashad 2083 | Change |
| Total assets | Rs 4,717,921,298 | Rs 4,709,292,676 | +0.18% |
| Total equity | Rs 4,455,744,050 | Rs 4,426,030,565 | +0.67% |
| Non-current financial liabilities (loan) | Rs 230,756,217 | Rs 203,048,196 | +13.65% |
| Current borrowings | Rs 1,140,360 | Rs 42,984,741 | −97.35% |
| Investment | Rs 910,071,132 | Rs 953,535,102 | −4.56% |
| Other financial assets | Rs 552,809,576 | Rs 468,388,489 | +18.02% |
| Cash and equivalents | Rs 555,411,428 | Rs 578,205,156 | −3.94% |
| Current liabilities | Rs 31,421,031 | Rs 80,213,915 | −60.83% |
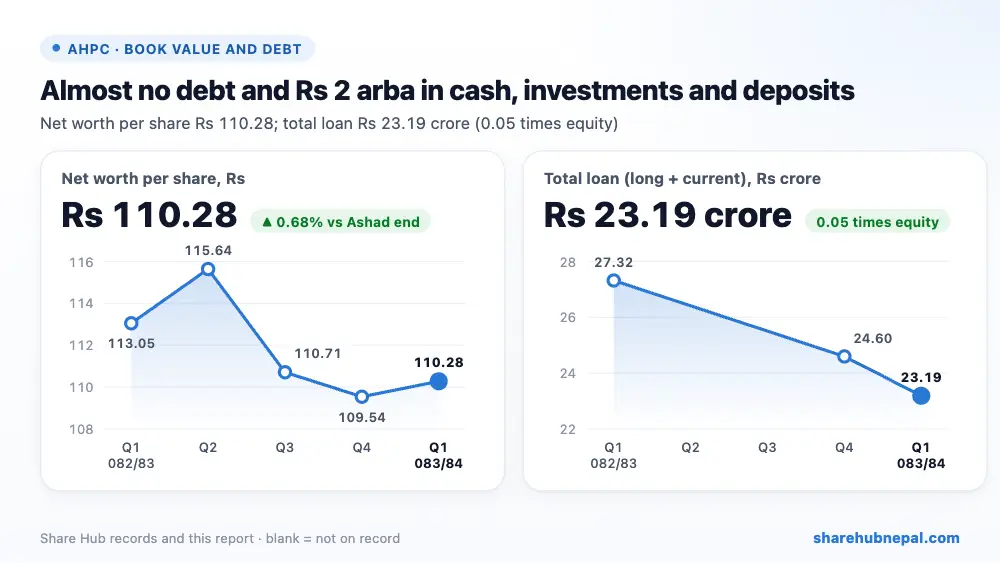
The balance sheet is very safe: total loans are only Rs 23.19 crore (0.05 times equity) after Rs 4.18 crore of current borrowings was repaid. The company holds Rs 55.54 crore in cash, Rs 91.01 crore in investments and Rs 55.28 crore in other financial assets — about Rs 2.02 arba together, close to half its equity. The liquidity ratio is 66.96. The question is how well this idle money is used: it earns other income, but it also keeps return on equity very low (about 2.7% annualised).
4. Per-share figures and valuation
| Indicator | Value |
| EPS (annualised) | Rs 2.94 |
| Net worth per share | Rs 110.28 |
| Market price (Ashwin end) | Rs 263.6 |
| P/E (annualised) | 89.66x |
| P/B | 2.39x |
At the Ashwin-end price of Rs 263.6, the share trades at 89.66 times annualised EPS and 2.39 times net worth per share. The P/E of about 90 is high because earnings are small relative to capital; the share trades at about 2.4 times net worth, a large part of which is cash and investments.
Conclusion
Positives: almost no debt, about Rs 2 arba of cash, investments and financial assets, other income up 181%, two new projects (Upper Kabeli-2 and Budhum Khola) with generation licences, and no legal cases.
Watch: profit down 34.44%, power sales down 17.47% and cost of sales up 86.77% with no explanation, very low EPS and ROE, profit falling for three quarters, and Share Hub's Q4 record differs from the audited figure.
Watch why sales and costs moved, the PPA for the two new projects, and how the large cash pile is used.
Figures are from the company's unaudited Q1 report; quarter trends use Share Hub records. This is not investment advice.

