













Arun Kabeli Power Ltd. – First Quarter Analysis, FY 2083/84
Unaudited results as on Ashwin end 2083, compared with the same quarter last year (Ashwin end 2082) and with Ashad end 2083.
Summary
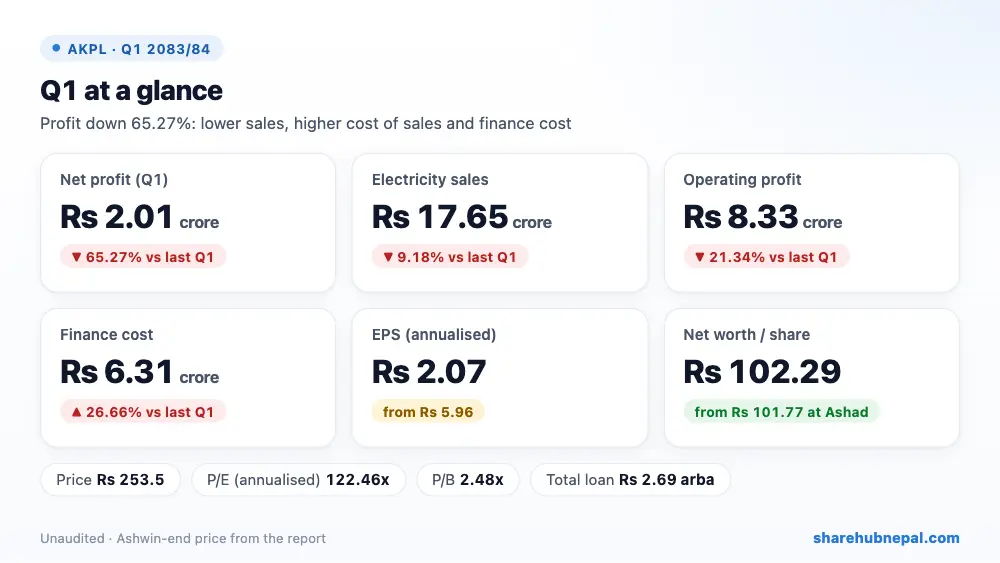
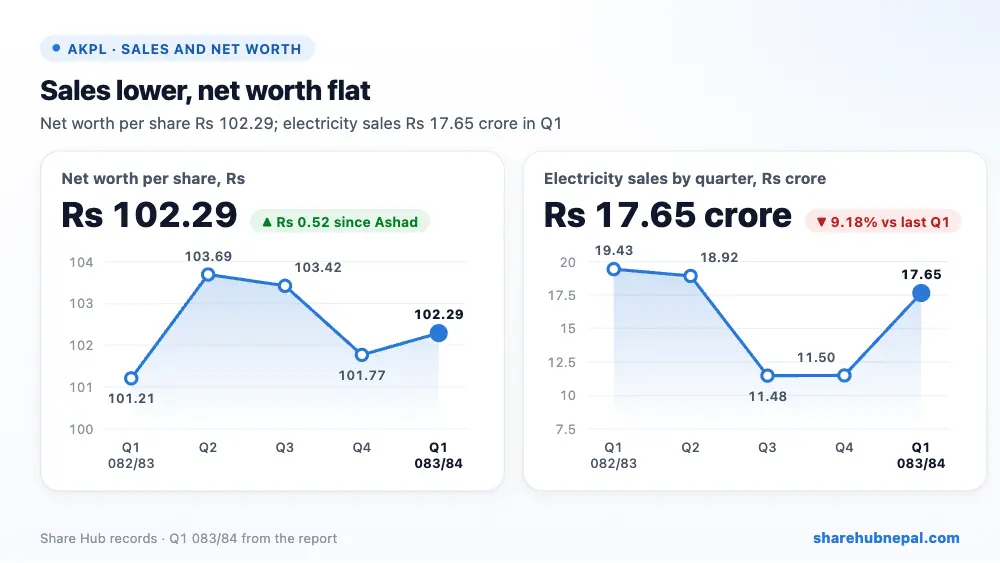
Arun Kabeli Power earned a net profit of Rs 2.01 crore in the first quarter of FY 2083/84, down 65.27% from Rs 5.80 crore in the same quarter last year. Electricity sales fell 9.18% to Rs 17.65 crore, cost of sales more than doubled to Rs 2.78 crore, and finance cost rose 26.66% to Rs 6.31 crore as borrowing grew. A smaller fair-value loss on shares (Rs 32.35 lakh against Rs 1.72 crore) softened the fall. Annualised EPS is Rs 2.07 and net worth per share is Rs 102.29.
| Indicator | Q1 2083/84 | Q1 2082/83 | Change |
| Revenue from sales | Rs 176,459,141 | Rs 194,287,275 | −9.18% |
| Cost of sales | Rs 27,770,963 | Rs 12,246,822 | +126.76% |
| Other income | −Rs 2,355,864 | −Rs 17,241,775 | +86.34% |
| Operating profit | Rs 83,257,607 | Rs 105,843,496 | −21.34% |
| Finance cost | Rs 63,118,499 | Rs 49,832,161 | +26.66% |
| Income tax | −Rs 607,589 | −Rs 3,663,877 | +83.42% |
| Net profit | Rs 20,146,553 | Rs 58,006,074 | −65.27% |
| EPS (annualised) | 2.07 | 5.96 | – |
| Net worth per share | 102.29 | 101.21 | – |
1. Where the profit came from
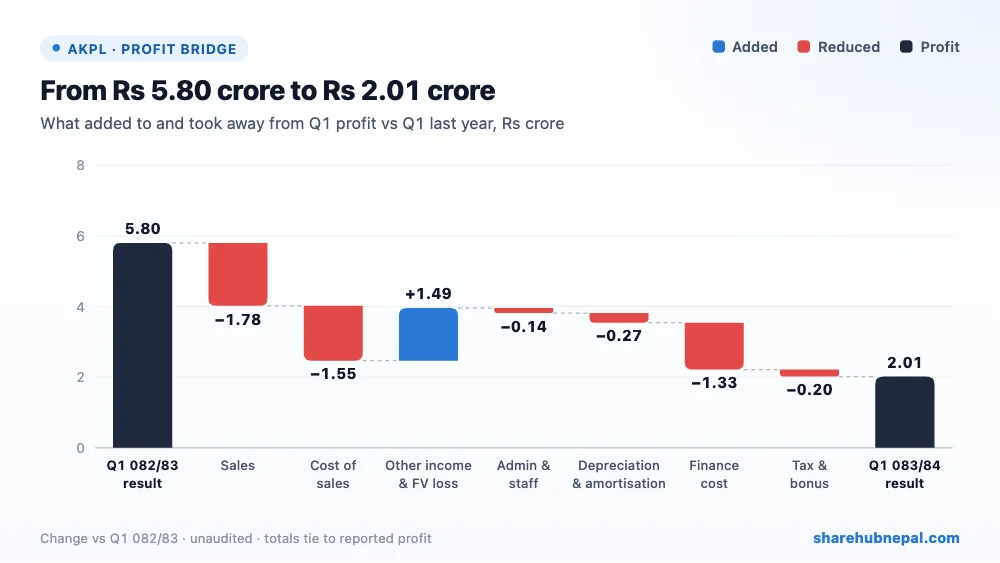
Lower electricity sales took Rs 1.78 crore off profit and the higher cost of sales another Rs 1.55 crore. Finance cost added Rs 1.33 crore, depreciation Rs 27.07 lakh and admin and staff costs Rs 14.12 lakh. The much smaller fair-value loss on listed shares, plus other income of Rs 8.79 lakh, gave back Rs 1.49 crore. Tax and bonus together cost Rs 19.87 lakh more, mainly because last year's deferred tax credit was bigger.
2. Profit through the year
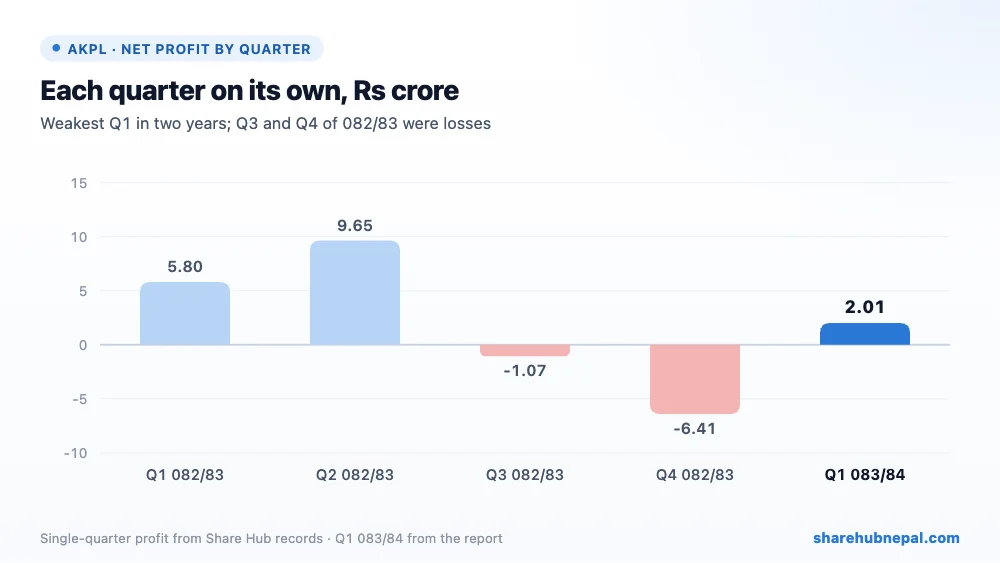
Profit by quarter (Share Hub records): Q1 082/83: Rs 5.80 crore, Q2 082/83: Rs 9.65 crore, Q3 082/83: −Rs 1.07 crore, Q4 082/83: −Rs 6.41 crore, Q1 083/84: Rs 2.01 crore. Quarter figures are worked out from Share Hub year-to-date records. FY 2082/83 ended with a profit of Rs 7.97 crore (EPS Rs 2.05): a strong first half, then losses in Q3 and Q4 as dry-season sales dropped and finance cost and fair-value losses on shares (Rs 6.78 crore for the year) piled up. This Q1, a monsoon quarter, is the weakest Q1 of the two years.
3. Debt and balance sheet
| Particulars | Ashwin 2083 | Ashad 2083 | Change |
| Total assets | Rs 7,361,075,636 | Rs 7,316,444,414 | +0.61% |
| Total equity | Rs 3,985,053,071 | Rs 3,964,906,518 | +0.51% |
| Long-term borrowings | Rs 2,692,274,279 | Rs 2,763,014,134 | −2.56% |
| Cash and equivalents | Rs 13,316,838 | Rs 48,281,553 | −72.42% |
Total assets are Rs 7.36 arba (Rs 188.94 per share): the Kabeli B-1 project intangible of Rs 4.76 arba, plus Rs 2.23 arba put into other companies (investment Rs 85.65 crore, advance for investment Rs 1.22 arba and Rs 15.11 crore of listed shares). Equity rose by the quarter's profit to Rs 3.99 arba (Rs 102.29 per share). The long-term loan is Rs 2.69 arba (Rs 2.76 arba at Ashad end, Rs 2.27 arba a year ago), and current financial liabilities rose to Rs 64.48 crore from Rs 54.95 crore (Rs 16.85 crore a year ago). Cash fell to Rs 1.33 crore from Rs 4.83 crore while receivables rose to Rs 19.95 crore from Rs 6.89 crore. Current liabilities are larger than current assets (liquidity ratio 0.75).
4. Per-share figures and valuation
| Indicator | Value |
| EPS (annualised) | Rs 2.07 |
| Net worth per share | Rs 102.29 |
| Market price (Ashwin end) | Rs 253.5 |
| P/E (annualised) | 122.46x |
| P/B | 2.48x |
At the Ashwin-end price of Rs 253.5, the share trades at 122.46 times annualised EPS and 2.48 times net worth per share. That is very expensive: on last year's full-year EPS of Rs 2.05 the P/E is about 124 times, and the return on equity is only about 2% a year.
Conclusion
Positives: still in profit, much smaller fair-value loss on shares, long-term loan down Rs 7.07 crore since Ashad, net worth per share up to Rs 102.29.
Watch: profit down 65%, sales down 9%, cost of sales more than doubled with no explanation, finance cost up 27%, Rs 2.23 arba tied up in other companies largely with borrowed money, cash only Rs 1.33 crore, current liabilities above current assets (0.75), P/E above 120.
The plant still earns well before interest, but borrowing to invest in other companies is eating the profit through interest and share-price losses. Last year's dry-season quarters were losses, so Q2 will show whether the company can stay in profit.
Figures are from the company's unaudited Q1 report; quarter trends use Share Hub records. This is not investment advice.

