













Asian Life Insurance Company Limited – First Quarter Analysis, FY 2083/84
Unaudited results as on Ashwin end 2083, compared with the same quarter last year (Ashwin end 2082) and with Ashad end 2083.
Summary
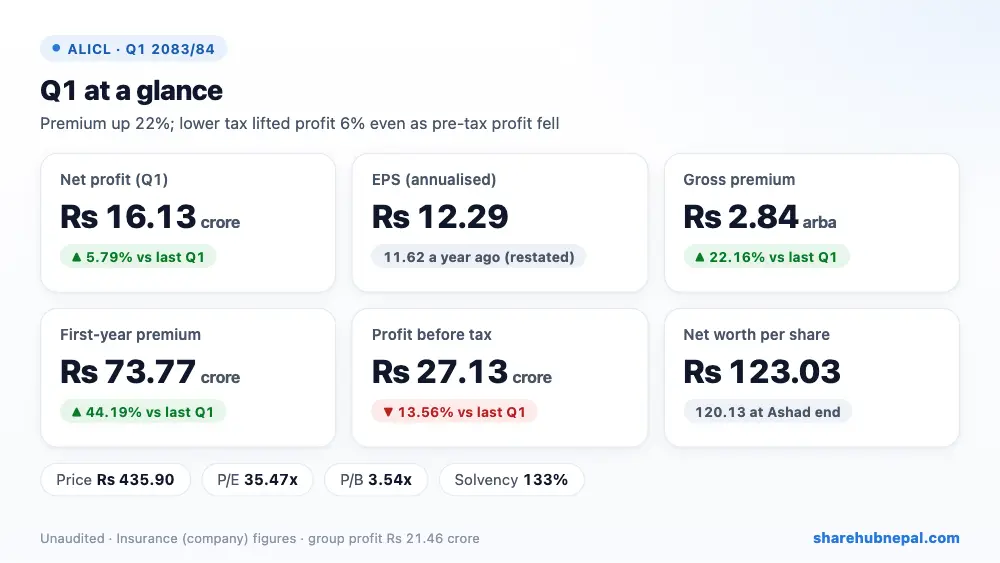
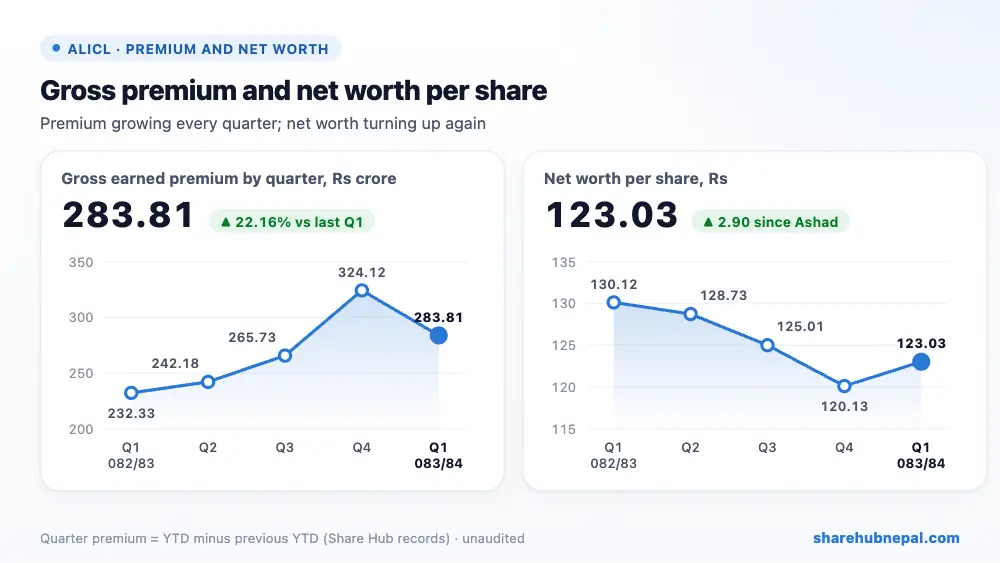
Asian Life Insurance earned a net profit of Rs 16.13 crore in the first quarter of 2083/84, up 5.79% from Rs 15.25 crore a year ago. Annualised EPS is Rs 12.29 (Rs 11.62 last year, restated) and net worth per share rose to Rs 123.03 from Rs 120.13 at Ashad end. With its share of associates' profit, the group earned Rs 21.46 crore (group EPS Rs 16.35).
Business grew well: gross earned premium rose 22.16% to Rs 2.84 arba, with first-year premium up 44.19% to Rs 73.77 crore (single premium up 61.78%) and renewal premium up 15.94%. But most of the extra premium went into benefits and policy reserves (net benefits up 17.88% to Rs 2.95 arba), commission rose 20.49% and other operating expenses 42.91%, while investment income grew only 1.09%. So profit before tax fell 13.56% to Rs 27.13 crore; a 31.85% lower tax bill is what lifted net profit.
| Indicator | Q1 2083/84 | Q1 2082/83 | Change |
| Gross earned premium | Rs 2,838,084,092 | Rs 2,323,309,515 | +22.16% |
| Net earned premium | Rs 2,772,237,357 | Rs 2,284,023,593 | +21.38% |
| Investment income and policy-loan interest | Rs 940,689,619 | Rs 927,080,204 | +1.47% |
| Other income | Rs 20,897,709 | Rs 26,570,447 | −21.35% |
| Net benefits, claims and change in reserves | Rs 2,953,584,715 | Rs 2,505,660,273 | +17.88% |
| Commission and service fees | Rs 250,037,002 | Rs 207,396,240 | +20.56% |
| Staff and other operating expenses | Rs 258,874,253 | Rs 210,724,067 | +22.85% |
| Profit before tax | Rs 271,328,716 | Rs 313,893,664 | −13.56% |
| Income tax | Rs 109,983,530 | Rs 161,380,622 | −31.85% |
| Net profit | Rs 161,345,186 | Rs 152,513,042 | +5.79% |
| EPS (annualised) | 12.29 | 11.62 | – |
1. Where the profit came from
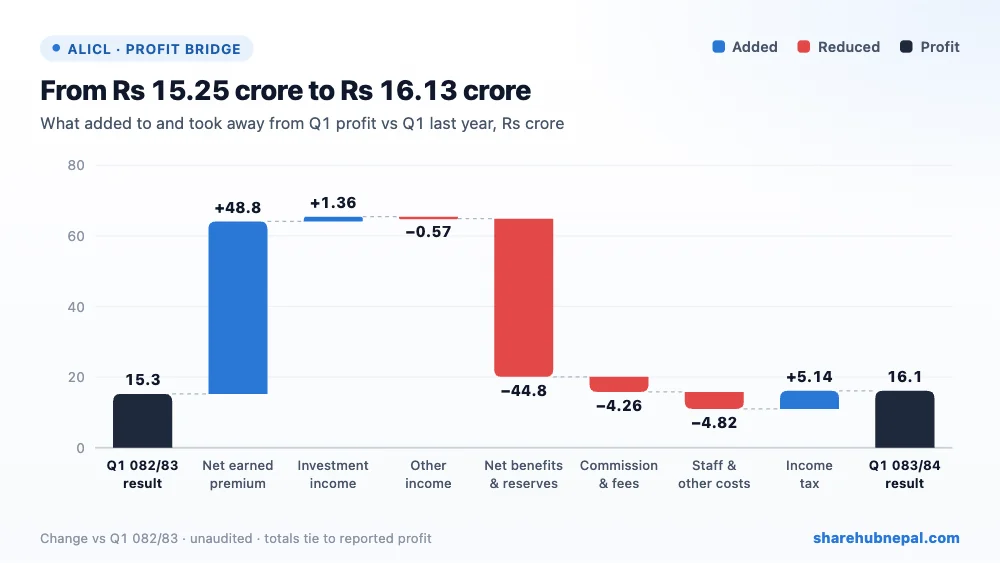
Compared with last year's Q1, higher net earned premium added Rs 48.82 crore, higher investment and policy-loan income Rs 1.36 crore and lower tax Rs 5.14 crore. Against that, higher net benefits and reserves took away Rs 44.79 crore, commission and service fees Rs 4.26 crore, staff and other operating costs Rs 4.82 crore and lower other income Rs 56.73 lakh. The net result is Rs 88.32 lakh more profit.
2. Profit through the year
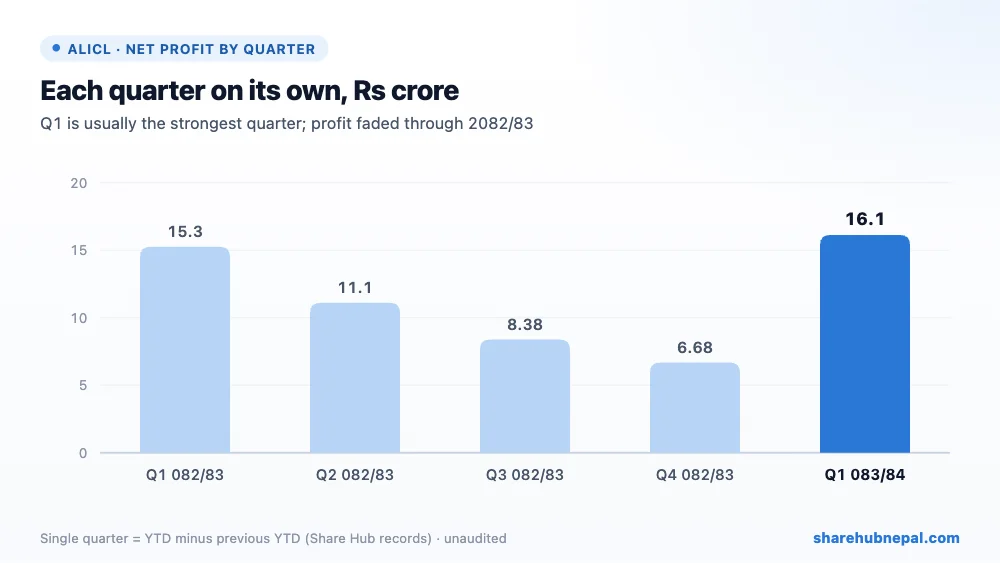
Based on Share Hub's records, single-quarter profit in 2082/83 was Rs 15.25 crore in Q1, Rs 11.11 crore in Q2, Rs 8.38 crore in Q3 and Rs 6.68 crore in Q4 (full year Rs 41.42 crore). Profit faded through the year even as premium grew every quarter. This Q1 is slightly better than last year's, but the annualised EPS of Rs 12.29 assumes the year holds this pace, which did not happen last year.
3. Balance sheet and solvency
| Particulars | Ashwin 2083 | Ashad 2083 | Change |
| Investments | Rs 50,243,953,981 | Rs 50,613,906,989 | −0.73% |
| Policyholder and other loans | Rs 5,320,891,711 | Rs 5,273,386,835 | +0.90% |
| Cash and cash equivalents | Rs 3,636,870,183 | Rs 1,610,680,867 | +125.80% |
| Investment in associates | Rs 2,832,215,876 | Rs 2,832,215,876 | +0.00% |
| Gross insurance contract liabilities | Rs 54,977,055,433 | Rs 53,134,186,493 | +3.47% |
| Total equity | Rs 6,460,610,385 | Rs 6,308,244,078 | +2.42% |
| Total assets | Rs 63,873,608,960 | Rs 62,335,123,930 | +2.47% |
Total assets are Rs 63.87 arba, almost all backing policyholder liabilities of Rs 54.98 arba; the life fund is Rs 54.49 arba (up 12.39% in a year). Investments are Rs 50.24 arba. A big shift is visible: long-term investments fell to Rs 27.39 arba from Rs 43.93 arba a year ago while short-term investments rose to Rs 25.77 arba from Rs 6.11 arba, and cash rose to Rs 3.64 arba — the company is holding much more money in short-term deposits. It also says it has started investing in hydropower, tourism and airlines. Policyholder loans are Rs 5.30 arba. Equity is Rs 6.46 arba; it rose Rs 4.43 crore less than the quarter's total comprehensive income, which the report does not explain.
4. Per-share figures and valuation
| Indicator | Value |
| EPS (annualised) | Rs 12.29 |
| Group EPS (annualised) | Rs 16.35 |
| Net worth per share | Rs 123.03 |
| Total assets per share | Rs 1,216.36 |
| Market price (Q1 close) | Rs 435.90 |
| P/E | 35.47x |
| P/B | 3.54x |
| Solvency ratio (FY 2081/82) | 133% |
The Q1 closing price was Rs 435.90 (range Rs 381.40 to Rs 455.70). That is 35.47 times annualised EPS and 3.54 times net worth per share; on group EPS of Rs 16.35 the P/E is about 26.7 times. The solvency ratio is 133% (latest audited, FY 2081/82), down from 136%, and the declared bonus rate to policyholders is Rs 42–75 per thousand.
Conclusion
Positives: strong premium growth (gross +22%, first-year +44%, single +62%), growing life fund, higher associate profits at group level, a positive OCI, much more cash and short-term deposits, and no legal cases.
Watch: profit before tax down 13.56% (the gain came from lower tax), investment income almost flat, operating costs up 43%, policies in force down to 651,015 from 944,760 and new policies issued down to 31,311 from 80,939 (growth is coming from bigger single-premium policies), solvency slipping to 133%, the unexplained Rs 4.43 crore gap in equity, and a P/E above 35.
A decent start on the surface: premium is growing fast and net profit is a little higher. Underneath, pre-tax profit fell and costs rose faster than income, so the quality of this growth needs watching over the next quarters.
Figures are from the company's unaudited Q1 report; quarter trends use Share Hub records. This is not investment advice.

