













Aviyan Laghubitta Bittiya Sanstha Limited – First Quarter Analysis, FY 2083/84
Unaudited results as on Ashwin end 2083, compared with the same quarter last year (Ashwin end 2082) and with the year end (Ashad end 2083).
Summary
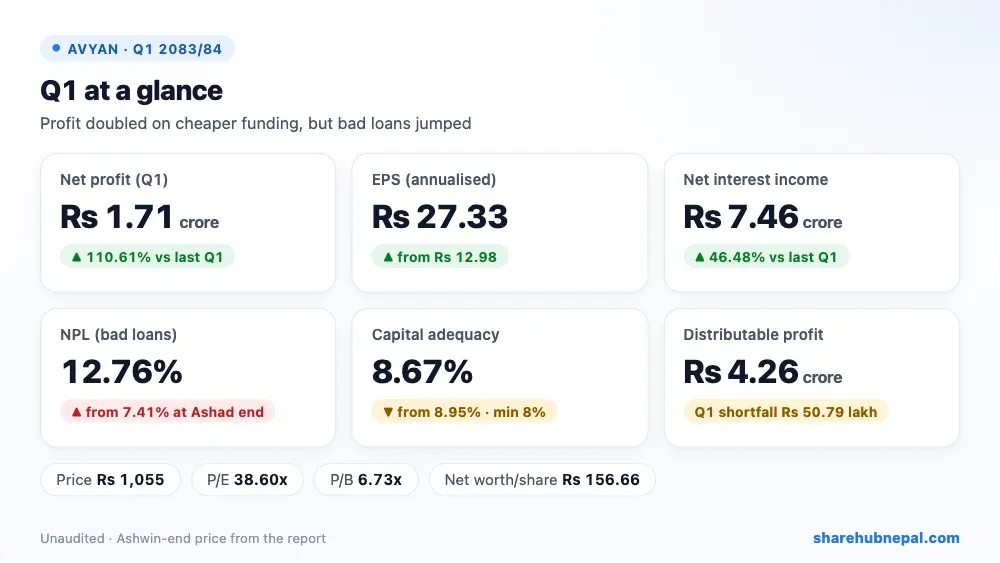
Aviyan Laghubitta earned a net profit of Rs 1.71 crore in the first quarter, up 110.61% from Rs 81.11 lakh in the same quarter last year. EPS is Rs 27.33 against Rs 12.98.
Compared with last year, the biggest help came from net interest income (+Rs 2.37 crore) and other costs (+Rs 28.09 lakh), while the biggest drag was impairment (−Rs 77.23 lakh).
Aviyan Laghubitta earned Rs 1.71 crore in Q1, up 110.61% from Rs 81.11 lakh a year ago. Net interest income rose 46.48% to Rs 7.46 crore because interest income grew 10.02% while interest cost fell 22.13% (cost of funds 5.48% from 6.96%). Loan-loss charges rose 75.34% to Rs 1.80 crore and staff cost rose 22.21%, which took part of the gain.
| Indicator | Q1 2083/84 | Q1 2082/83 | Change |
| Net profit | Rs 17,083,330 | Rs 8,111,463 | +110.61% |
| Net interest income | Rs 74,636,402 | Rs 50,952,593 | +46.48% |
| Net fee and commission income | Rs 6,742,855 | Rs 6,950,690 | −2.99% |
| Impairment charge/(reversal) | Rs 17,974,190 | Rs 10,251,162 | +75.34% |
| Operating profit | Rs 24,404,757 | Rs 11,587,804 | +110.61% |
| EPS | Rs 27.33 | Rs 12.98 | – |
| Net worth per share | Rs 156.66 | Rs 158.75 | −1.32% |
| NPL | 12.76% | 7.69% | +5.07 pts |
| Capital adequacy | 8.67% | 8.88% | −0.21 pts |
1. Where the profit came from
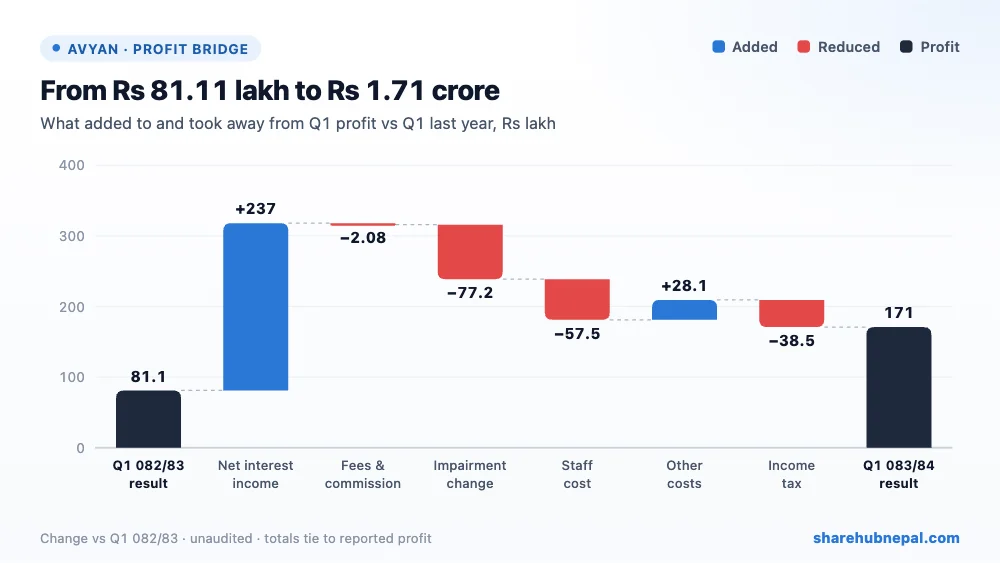
The bridge chart shows how Q1 profit moved from last year's Rs 81.11 lakh to this year's Rs 1.71 crore:
- Net interest income (+Rs 2.37 crore): interest income rose 10.02% while interest expense fell 22.13%.
- Impairment (−Rs 77.23 lakh): the bank set aside Rs 1.80 crore for loan losses, against Rs 1.03 crore last year.
- Staff cost (−Rs 57.45 lakh): personnel expenses rose 22.21% to Rs 3.16 crore.
- Income tax (−Rs 38.45 lakh): tax was Rs 73.21 lakh against Rs 34.76 lakh last year.
- Other costs (+Rs 28.09 lakh): other operating expenses, depreciation and non-operating items combined.
- Fees & commission (−Rs 2.08 lakh): net fee income was Rs 67.43 lakh against Rs 69.51 lakh.
In plain terms: operating costs took 47.9% of operating income, against 62.3% a year ago. Impairment took 22.1% of operating income.
2. Profit through the year
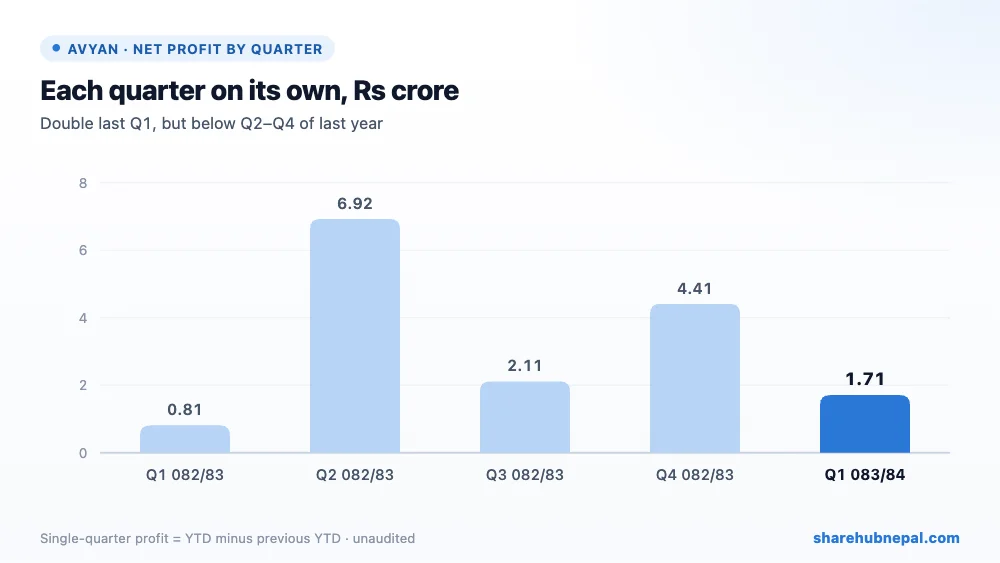
Looking at each quarter on its own (year-to-date profit minus the previous quarter's): Q1 082/83: Rs 81.11 lakh; Q2 082/83: Rs 6.92 crore; Q3 082/83: Rs 2.11 crore; Q4 082/83: Rs 4.41 crore; Q1 083/84: Rs 1.71 crore.
Based on Share Hub records, single-quarter profit in 2082/83 was Rs 81.11 lakh in Q1, Rs 6.92 crore in Q2, Rs 2.11 crore in Q3 and Rs 4.41 crore in Q4. This Q1 is double last year's Q1 but below the later quarters.
3. Deposits, loans and liquidity
| Particulars | Ashwin 2083 | Ashad 2083 | Change |
| Deposits from customers | Rs 363,970,737 | Rs 354,108,199 | +2.79% |
| Loans and advances to customers | Rs 3,661,579,278 | Rs 3,597,246,687 | +1.79% |
| Cash and cash equivalent | Rs 30,818,594 | Rs 96,199,621 | −67.96% |
| Balance with Nepal Rastra Bank | Rs 23,105,002 | Rs 19,604,847 | +17.85% |
| Investment securities | Rs 0 | Rs 0 | n/a |
| Total assets | Rs 3,756,630,506 | Rs 3,710,635,016 | +1.24% |
| Total equity | Rs 391,647,484 | Rs 396,875,331 | −1.32% |
In the quarter, deposits grew 2.79% and customer loans grew 1.79%. The credit-to-deposit ratio is 111.60% (104.87% a year ago).
Pricing: cost of funds 5.48% (from 6.96%), base rate 9.46% (from 11.25%), interest spread 8.74% (from 8.09%).
The report compares the balance sheet with Ashwin 2082; against the Share Hub Ashad record, loans grew 1.79% to Rs 3.66 arba and deposits 2.79% to Rs 36.40 crore. Borrowing is Rs 2.92 arba eight times deposits, so the company depends on bank funding. Equity fell slightly from Rs 39.69 crore at Ashad end to Rs 39.16 crore even after the quarter's profit, which suggests a dividend was paid out of reserves; the report does not explain it. Loans are 111.60% of deposits plus borrowing.
4. Bad loans and capital
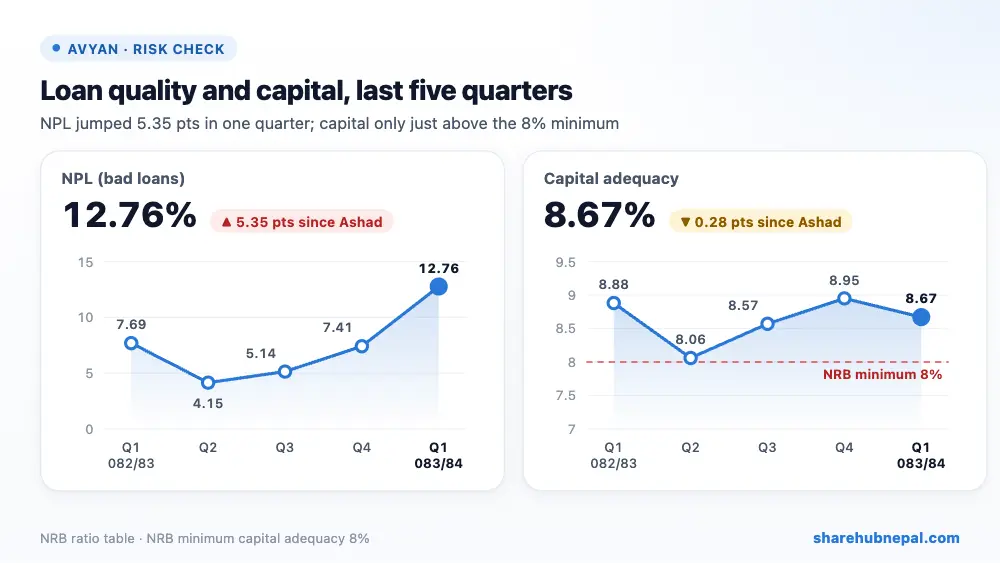
- NPL is 12.76%, against 7.41% at Ashad end and 7.69% a year ago. Loan-loss provisions cover 19.25% of bad loans (21.10% a year ago).
- Capital adequacy is 8.67%, against 8.95% at Ashad end and 8.88% a year ago. NRB's minimum is 8%, so the buffer is 0.67 points.
- Risk rose sharply. NPL jumped to 12.76% from 7.41% at Ashad end, and provisions cover only 19.25% of bad loans, so more charges are likely. Capital adequacy is 8.67%, only 0.67 points above the 8% minimum. The regulatory reserve took Rs 1.82 crore this quarter.
5. Distributable profit
| Particulars (Rs) | Amount |
| Net profit for the quarter | 17,083,330 |
| Less: general reserve | (3,416,666) |
| Less: client protection and CSR funds | (512,500) |
| Less: regulatory reserve | (18,233,280) |
| Q1 distributable profit (shortfall) | (5,079,116) |
| Opening retained earnings | 47,652,787 |
| Distributable profit at Ashwin end | 42,573,671 |
After Rs 39.29 lakh of required funds and a Rs 1.82 crore transfer to the regulatory reserve, the quarter shows a distributable shortfall of Rs 50.79 lakh. Distributable profit falls to Rs 4.26 crore (Rs 17.03 per share as printed).
6. Per-share figures and valuation
| Indicator | Value |
| EPS (as reported) | Rs 27.33 |
| Net worth per share | Rs 156.66 |
| Distributable EPS | Rs 17.03 |
| Closing price, Ashwin end 2083 | Rs 1055.00 |
| Price range during the quarter | Rs 975.00 – Rs 1200.00 |
| P/E (annualised EPS) | 38.6x |
| Price to book | 6.73x |
At Rs 1,055 the share trades at 38.60 times annualised EPS and 6.73 times net worth per share. With a thin capital buffer and fast-rising bad loans, that is a very high price.
Conclusion
Positives: profit doubled, net interest income up 46%, much cheaper funding, loan growth continuing.
Watch points: NPL up from 7.41% to 12.76% in one quarter with only 19% provision cover, capital just above the minimum, a distributable shortfall this quarter, and a P/B near 7.
Headline profit doubled, but the sudden jump in bad loans and the thin capital buffer are serious warning signs.
Based on the company's unaudited first-quarter report. Figures may change after audit or regulator review. This is not investment advice.

