













City Hotel Limited – First Quarter Analysis, FY 2083/84
Unaudited results as on Ashwin end 2083, compared with the same quarter last year (Ashwin end 2082) and with Ashad end 2083.
Summary
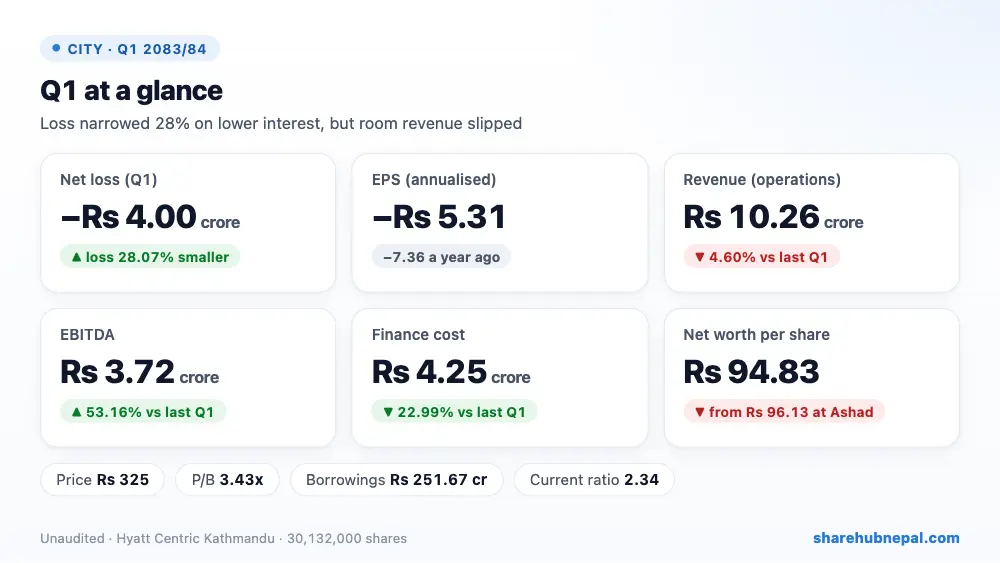
City Hotel, which runs the Hyatt Centric Kathmandu at Soaltee Mode, posted a net loss of Rs 4.00 crore in the first quarter, 28.07% smaller than the loss of Rs 5.57 crore a year ago. Annualised EPS is −Rs 5.31.
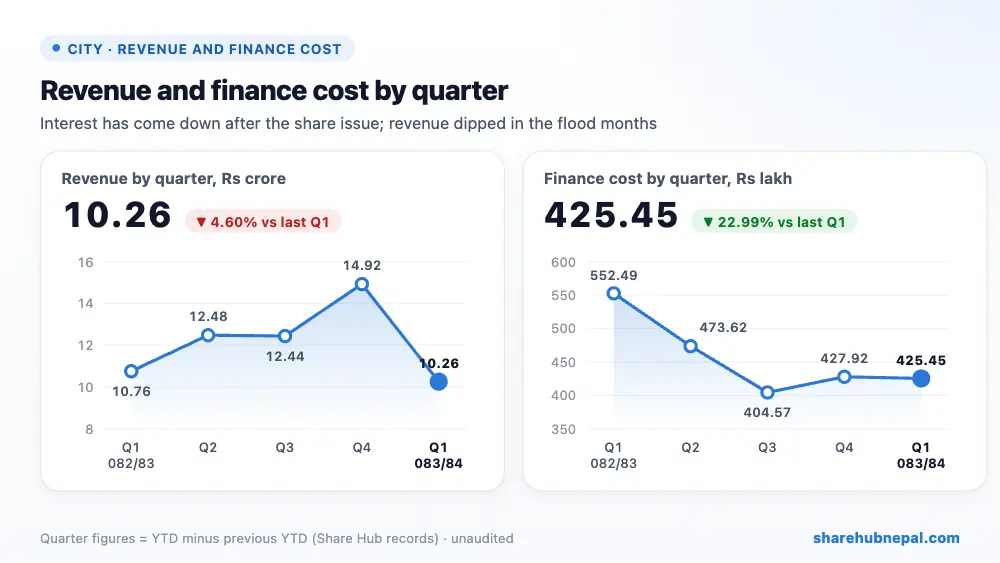
Revenue from operations fell 4.60% to Rs 10.26 crore; the company says the August–September floods and bad weather hurt hotel business in Kathmandu. Miscellaneous income rose to Rs 1.83 crore from Rs 79.49 lakh, and food, staff and brand fee costs fell, so EBITDA rose 53.16% to Rs 3.72 crore. Finance cost fell 22.99% to Rs 4.25 crore, but interest and depreciation of Rs 3.55 crore still pushed the hotel into a loss.
| Indicator | Q1 2083/84 | Q1 2082/83 | Change |
| Revenue from operations | Rs 102,641,999 | Rs 107,586,926 | −4.60% |
| Miscellaneous income | Rs 18,331,338 | Rs 7,948,960 | +130.61% |
| Cost of goods sold | Rs 34,708,961 | Rs 40,525,160 | −14.35% |
| Employee cost | Rs 17,234,821 | Rs 19,505,526 | −11.64% |
| Administrative and operating | Rs 29,871,462 | Rs 27,789,927 | +7.49% |
| EBITDA | Rs 37,194,665 | Rs 24,284,008 | +53.17% |
| Finance cost | Rs 42,544,984 | Rs 55,249,027 | −22.99% |
| Depreciation and amortization | Rs 35,531,403 | Rs 35,353,193 | +0.50% |
| Net profit (loss) | −Rs 40,033,390 | −Rs 55,652,164 | +28.06% |
| EPS (annualised) | -5.31 | -7.36 | – |
1. Where the profit came from
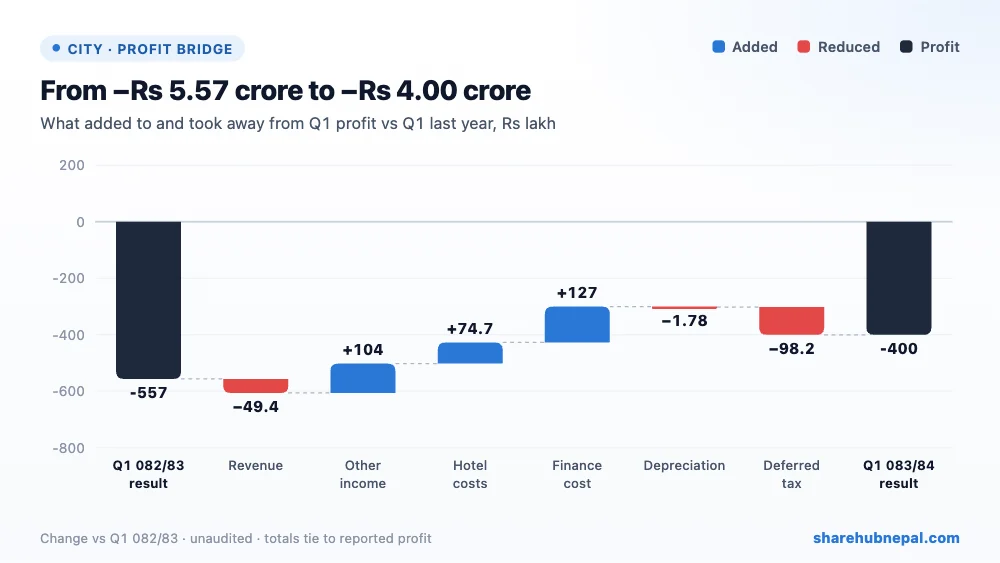
Compared with last year's Q1, lower finance cost added Rs 1.27 crore, higher other income Rs 1.04 crore and lower hotel costs Rs 74.73 lakh. Lower room and food revenue took away Rs 49.45 lakh, a smaller deferred tax credit Rs 98.18 lakh and slightly higher depreciation Rs 1.78 lakh. Net result: loss smaller by Rs 1.56 crore.
2. Profit through the year
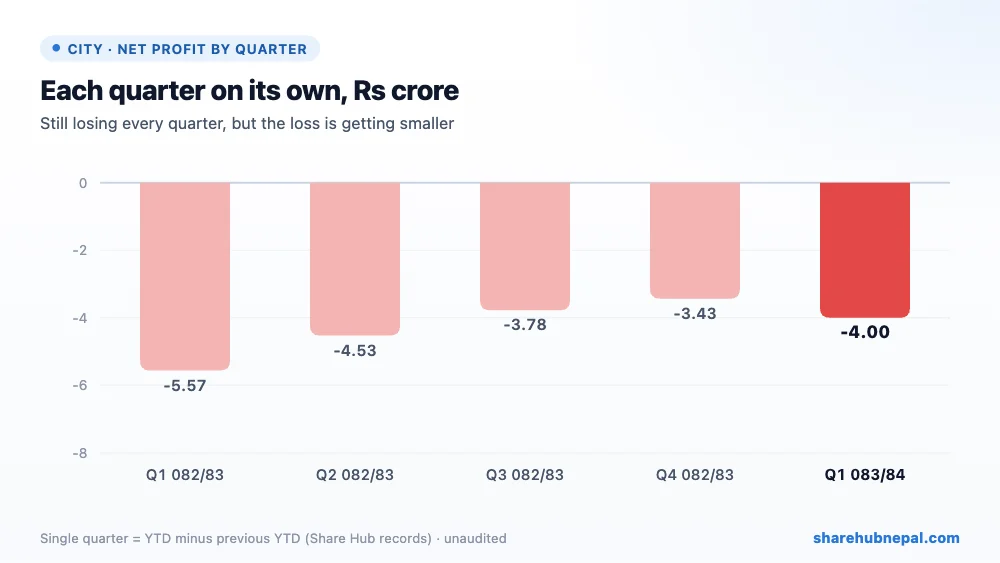
Based on Share Hub's records, City Hotel lost Rs 5.57 crore in Q1, Rs 4.53 crore in Q2, Rs 3.78 crore in Q3 and Rs 3.43 crore in Q4 of 2082/83 (full year Rs 17.31 crore). The loss had been shrinking each quarter; this Q1 loss of Rs 4.00 crore is a little higher than Q4 because of the flood months, but well below last year's Q1.
3. Debt and balance sheet
| Particulars | Ashwin 2083 | Ashad 2083 | Change |
| Long-term borrowings | Rs 2,481,035,836 | Rs 2,461,336,067 | +0.80% |
| Short-term borrowings | Rs 35,659,299 | Rs 54,677,761 | −34.78% |
| Property, plant and equipment | Rs 4,808,464,003 | Rs 4,835,334,397 | −0.56% |
| Current assets | Rs 453,942,350 | Rs 455,312,115 | −0.30% |
| Current liabilities | Rs 194,232,937 | Rs 201,711,316 | −3.71% |
| Total equity | Rs 2,857,468,893 | Rs 2,896,568,386 | −1.35% |
Borrowings are Rs 251.67 crore (Rs 248.10 crore long-term and Rs 3.57 crore short-term), about the same as at Ashad end but well below Rs 334.32 crore a year ago, after the company raised its share capital to Rs 301.32 crore. Current assets of Rs 45.39 crore are 2.34 times current liabilities. Equity fell to Rs 285.75 crore with the loss, and net worth per share to Rs 94.83, below the Rs 100 face value.
4. Per-share figures and valuation
| Indicator | Value |
| EPS (quarter, as printed) | Rs -1.33 |
| EPS (annualised) | Rs -5.31 |
| Net worth per share | Rs 94.83 |
| Total assets per share | Rs 185.31 |
| Market price (report) | Rs 325 |
| P/B | 3.43x |
| Current ratio | 2.34 |
At Rs 325 the share trades at 3.43 times net worth per share. P/E has no meaning while the company is in loss. The price depends on the hotel turning profitable as interest cost keeps falling.
Conclusion
Positives: loss down 28.07%, EBITDA up 53.16%, lower interest after cutting loans, lower operating costs and a comfortable current ratio of 2.34.
Watch: still a net loss every quarter, revenue from operations down 4.60%, part of the gain from one-off other income, net worth below face value, and heavy borrowing of Rs 251.67 crore.
City Hotel is slowly reducing its losses as interest falls, but room revenue needs to grow for it to reach profit. Watch the busier autumn quarter (Q2).
Figures are from the company's unaudited Q1 report; quarter trends use Share Hub records. This is not investment advice.

