













Chirkhwa Hydropower Ltd – First Quarter Analysis, FY 2083/84
Unaudited results as on Ashwin end 2083, compared with the same quarter last year (Ashwin end 2082) and with Ashad end 2083.
Summary
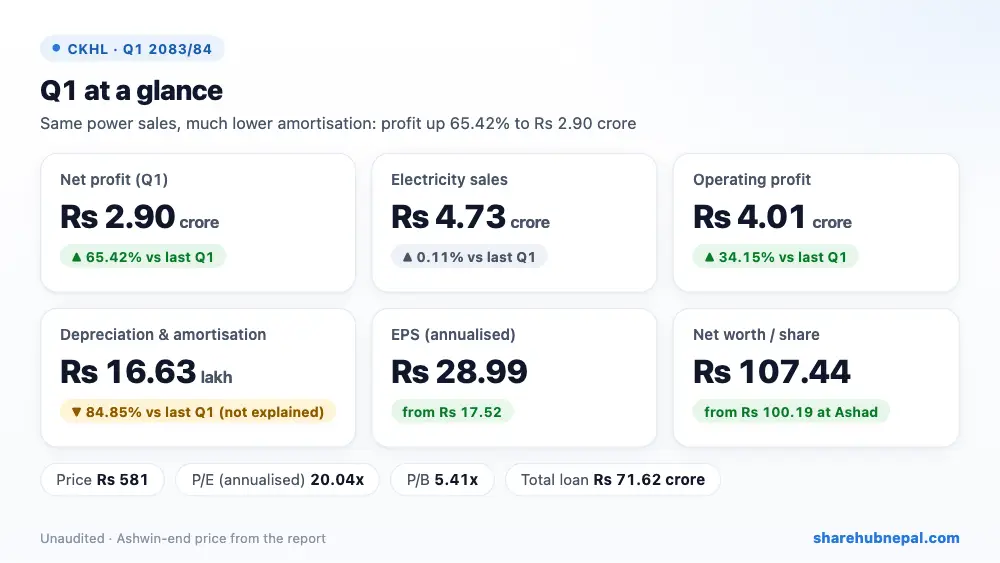
Chirkhwa Hydropower earned a net profit of Rs 2.90 crore in the first quarter of FY 2083/84, up 65.42% from Rs 1.75 crore a year ago. Electricity sales were flat at Rs 4.73 crore. The jump comes mainly from depreciation and amortisation, which fell to Rs 16.63 lakh from Rs 1.10 crore; finance cost also fell 10.24%. The report does not explain the lower amortisation, so part of this gain is an accounting change rather than better operations. Quarter EPS is Rs 7.25 (Rs 28.99 annualised) and net worth per share has climbed back above Rs 100 to Rs 107.44.
| Indicator | Q1 2083/84 | Q1 2082/83 | Change |
| Revenue from sales | Rs 47,326,258 | Rs 47,273,923 | +0.11% |
| Cost of sales | Rs 3,816,008 | Rs 4,395,454 | −13.18% |
| Other income | Rs 0 | Rs 0 | – |
| Operating profit | Rs 40,072,956 | Rs 29,872,864 | +34.15% |
| Finance cost | Rs 11,084,365 | Rs 12,348,561 | −10.24% |
| Income tax | Rs 0 | Rs 0 | – |
| Net profit | Rs 28,988,591 | Rs 17,524,304 | +65.42% |
| EPS (annualised) | 28.99 | 17.52 | – |
| Net worth per share | 107.44 | 91.32 | – |
1. Where the profit came from
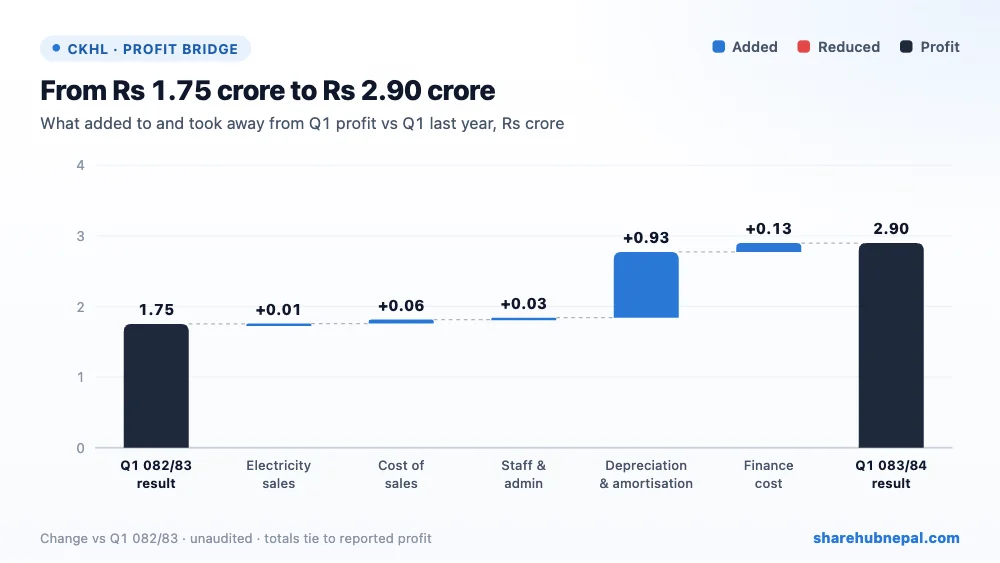
Sales of Rs 4.73 crore less cost of sales of Rs 38.16 lakh gave a gross profit of Rs 4.35 crore. Staff and admin costs fell to Rs 17.75 lakh and depreciation and amortisation to Rs 16.63 lakh, so operating profit rose 34.15% to Rs 4.01 crore. Finance cost of Rs 1.11 crore (Rs 1.23 crore) was the main expense. No tax was charged, so net profit was Rs 2.90 crore.
2. Profit through the year
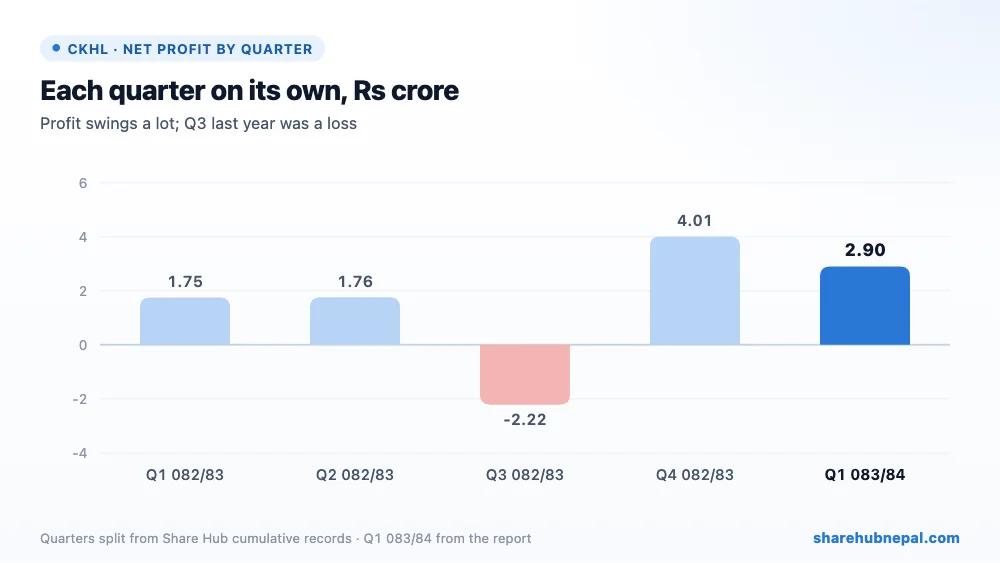
Profit by quarter (Share Hub cumulative records, split into quarters): Q1 082/83: Rs 1.75 crore, Q2 082/83: Rs 1.76 crore, Q3 082/83: −Rs 2.22 crore, Q4 082/83: Rs 4.01 crore, Q1 083/84: Rs 2.90 crore. Last year's quarters swung widely, including a loss of Rs 2.22 crore in Q3, and the full year gave EPS of Rs 13.25. Q1 is the monsoon peak, so annualised EPS of Rs 28.99 is far above a normal full year.
3. Debt and balance sheet
| Particulars | Ashwin 2083 | Ashad 2083 | Change |
| Total assets | Rs 1,200,533,878 | Rs 1,186,204,229 | +1.21% |
| Total equity | Rs 429,767,578 | Rs 400,778,987 | +7.23% |
| Long-term loans | Rs 684,397,251 | Rs 686,860,251 | −0.36% |
| Short-term loans | Rs 31,800,000 | Rs 39,300,000 | −19.08% |
| Loans and advances | Rs 61,880,687 | Rs 57,995,870 | +6.70% |
| Trade receivables | Rs 31,375,214 | Rs 19,295,952 | +62.60% |
| Cash and equivalents | Rs 2,568,672 | Rs 2,622,690 | −2.06% |
| Trade and other payables | Rs 52,243,357 | Rs 56,703,162 | −7.87% |
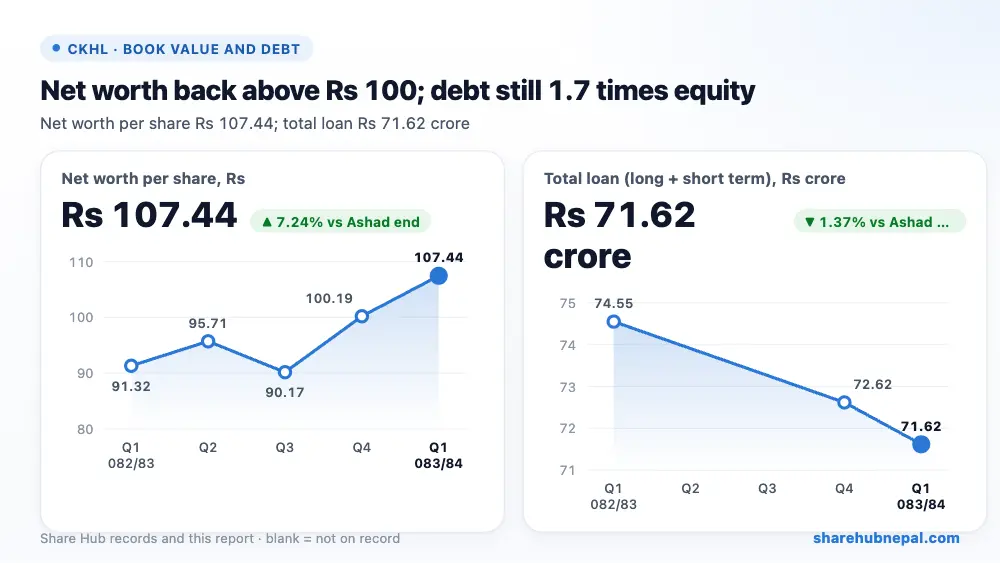
Total loans are Rs 71.62 crore (long-term Rs 68.44 crore plus short-term Rs 3.18 crore), 1.67 times equity, with Rs 75 lakh of short-term loan repaid this quarter. Cash is thin at Rs 25.69 lakh, but receivables (Rs 3.14 crore) and loans and advances (Rs 6.19 crore) lift the current ratio to 1.13. Equity rose by the Q1 profit to Rs 42.98 crore.
4. Per-share figures and valuation
| Indicator | Value |
| EPS (annualised) | Rs 28.99 |
| Net worth per share | Rs 107.44 |
| Market price (Ashwin end) | Rs 581 |
| P/E (annualised) | 20.04x |
| P/B | 5.41x |
At the Ashwin-end price of Rs 581, the share trades at 20.04 times annualised EPS and 5.41 times net worth per share. The report prints a P/E of 80.17 on the quarter EPS; on last year's EPS of Rs 13.25 it is about 44 times, and the price is 5.4 times net worth.
Conclusion
Positives: profit up 65.42%, finance cost down, net worth back above Rs 100, short-term loans reduced, and no legal cases.
Watch: sales did not grow, most of the gain comes from an unexplained cut in amortisation, the report mislabels quarter EPS as annualised, cash is low, and debt is 1.67 times equity.
Watch whether amortisation stays this low (and why), dry-season sales, and loan repayment.
Figures are from the company's unaudited Q1 report; quarter trends use Share Hub records. This is not investment advice.

