













Ghorahi Cement Industry Limited – First Quarter Analysis, FY 2083/84
Unaudited results as on Ashwin end 2083, compared with the same quarter last year (Ashwin end 2082).
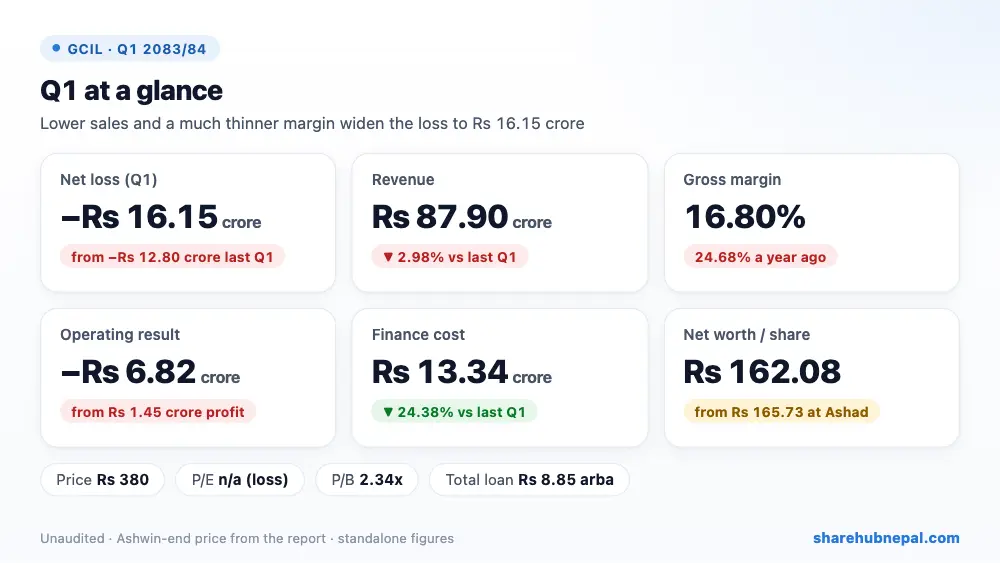
Summary
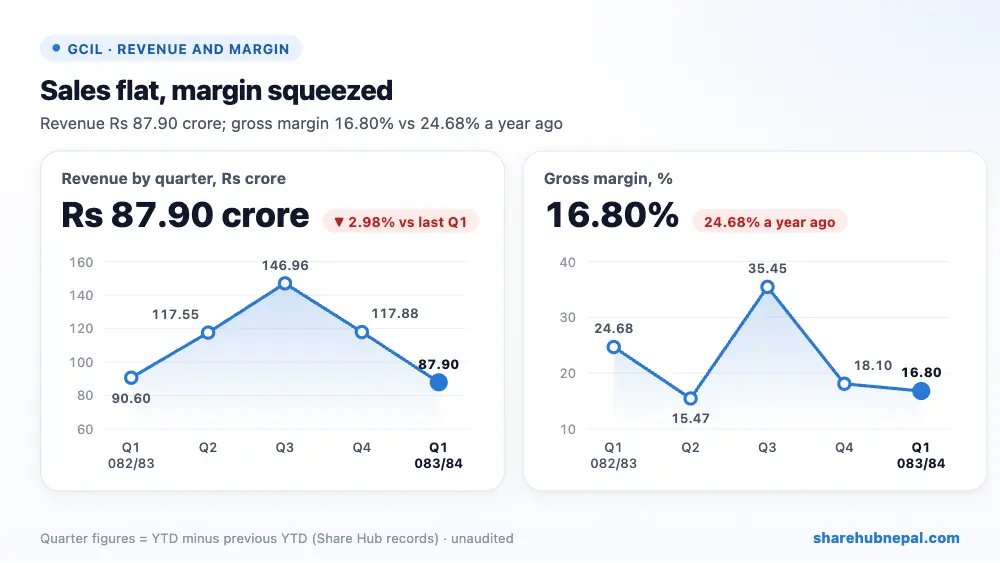
Ghorahi Cement posted a net loss of Rs 16.15 crore in the first quarter of FY 2083/84, 26.16% bigger than the loss of Rs 12.80 crore a year ago. Quarter EPS is Rs −3.21.,Revenue fell 2.98% to Rs 87.90 crore while cost of sales rose 7.17%, so gross profit dropped 33.97% to Rs 14.77 crore and the gross margin fell to 16.80% from 24.68%. The company says the cement industry has far more capacity than demand, competition is fierce and selling prices are under pressure, while coal and diesel costs are rising. Admin and selling costs rose 21.81%. The operating result turned to a loss of Rs 6.82 crore (profit of Rs 1.45 crore last year). Finance cost fell 24.38% to Rs 13.34 crore, but it was not enough.
| Indicator | Q1 2083/84 | Q1 2082/83 | Change |
| Revenue from operations | Rs 879,016,542 | Rs 906,021,961 | −2.98% |
| Cost of sales | Rs 731,353,098 | Rs 682,401,058 | +7.17% |
| Gross profit | Rs 147,663,444 | Rs 223,620,903 | −33.97% |
| Other income | Rs 7,762,090 | Rs 5,948,864 | +30.48% |
| Admin, selling and distribution | Rs 53,092,731 | Rs 43,587,370 | +21.81% |
| Depreciation and amortisation | Rs 170,550,872 | Rs 171,518,476 | −0.56% |
| Profit / (loss) from operations | −Rs 68,218,069 | Rs 14,463,921 | Turned to loss |
| Finance costs | Rs 133,386,722 | Rs 176,382,134 | −24.38% |
| Loss before tax | −Rs 201,604,791 | −Rs 161,918,213 | −24.51% |
| Income tax (net of deferred credit) | −Rs 40,089,196 | −Rs 33,897,386 | −18.27% |
| Net loss | −Rs 161,515,595 | −Rs 128,020,827 | −26.16% |
| EPS (quarter) | -3.21 | -2.80 | – |
1. Where the profit came from
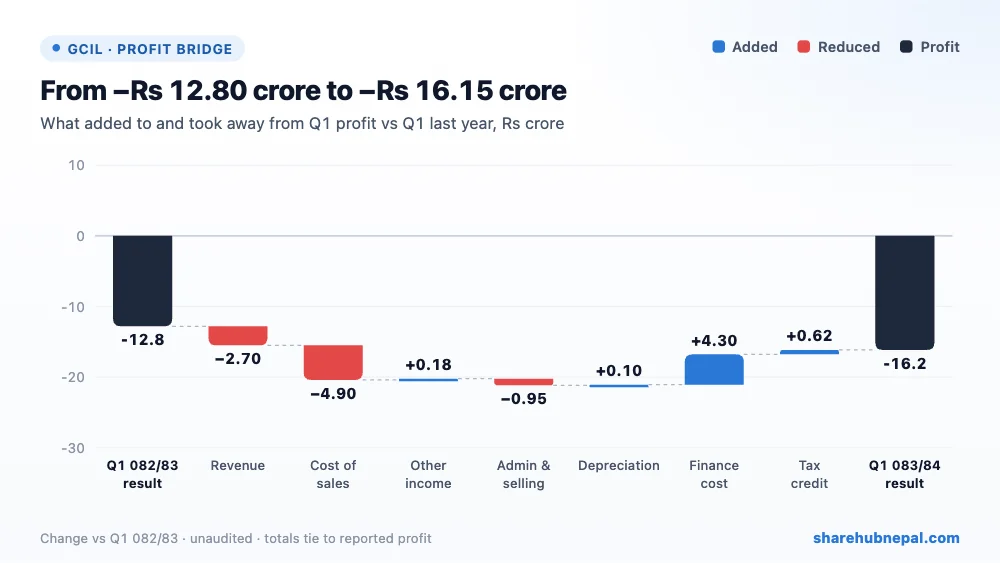
Lower sales cost Rs 2.70 crore and higher cost of sales Rs 4.90 crore, so gross profit fell Rs 7.60 crore. Admin and selling costs added Rs 95.05 lakh. Lower interest saved Rs 4.30 crore and a slightly bigger tax credit helped by Rs 61.92 lakh, but the loss still widened by Rs 3.35 crore.
2. Profit through the year
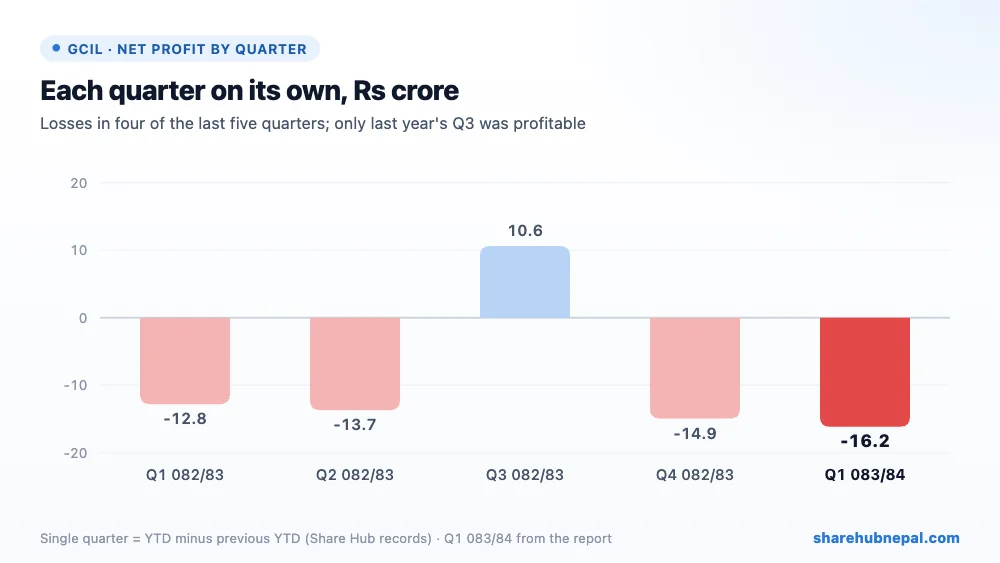
Last year Ghorahi lost money in Q1 (Rs 12.80 crore), Q2 (Rs 13.69 crore) and Q4 (Rs 14.94 crore); only Q3, the main construction season, was profitable (Rs 10.62 crore). The full year ended with a loss of Rs 30.81 crore (EPS Rs −6.13).
3. Debt and balance sheet
| Particulars | Ashwin 2083 | Ashwin 2082 | Change |
| Property, plant and equipment | Rs 17,623,048,453 | Rs 18,207,025,048 | −3.21% |
| Inventories | Rs 1,545,707,810 | Rs 1,873,536,007 | −17.50% |
| Trade receivables | Rs 1,061,679,292 | Rs 1,419,486,534 | −25.21% |
| Cash and cash equivalents | Rs 129,288,784 | Rs 105,763,011 | +22.24% |
| Borrowings (long + short term) | Rs 8,853,676,298 | Rs 9,613,665,110 | −7.91% |
| Total equity | Rs 8,143,400,850 | Rs 8,513,370,147 | −4.35% |
Debt is heavy: Rs 6.14 arba of long-term secured loans plus Rs 2.72 arba of short-term borrowing, Rs 8.85 arba in total, 1.09 times equity — down from Rs 9.61 arba a year ago. The liquidity ratio is only 0.707, so current liabilities exceed current assets. Inventories and receivables fell during the year, which freed some cash. Equity fell to Rs 8.14 arba, about Rs 2.19 crore more than the quarter's loss.
4. Per-share figures and valuation
| Indicator | Value |
| EPS (quarter, report) | Rs -3.21 |
| Net worth per share (report) | Rs 162.08 |
| Market price (Ashwin end) | Rs 380 |
| P/B | 2.34x |
| Liquidity ratio (report) | 0.707 |
At Rs 380 the share trades at 2.34 times net worth per share. There is no profit to support a P/E; the price depends on a recovery in cement demand and margins.
Conclusion
Positives: finance cost down 24.38%, total debt lower than a year ago, inventories and receivables reduced, and the company expects cement demand to pick up with the construction season and exports.
Watch: a bigger loss, gross margin down to 16.80%, an operating loss, debt of Rs 8.85 arba with a liquidity ratio below 1, industry overcapacity and price pressure, rising coal and diesel costs, and a pending Supreme Court case over customs on 13 Ashok Leyland tippers.
Watch Q2–Q3 sales in the construction season, whether the gross margin recovers, and further debt reduction.
Figures are from the company's unaudited Q1 report; quarter trends use Share Hub records. This is not investment advice.

