













Ghalemdi Hydro Ltd. – First Quarter Analysis, FY 2083/84
Unaudited results as on Ashwin end 2083, compared with the same quarter last year (Ashwin end 2082) and with Ashad end 2083.
Summary
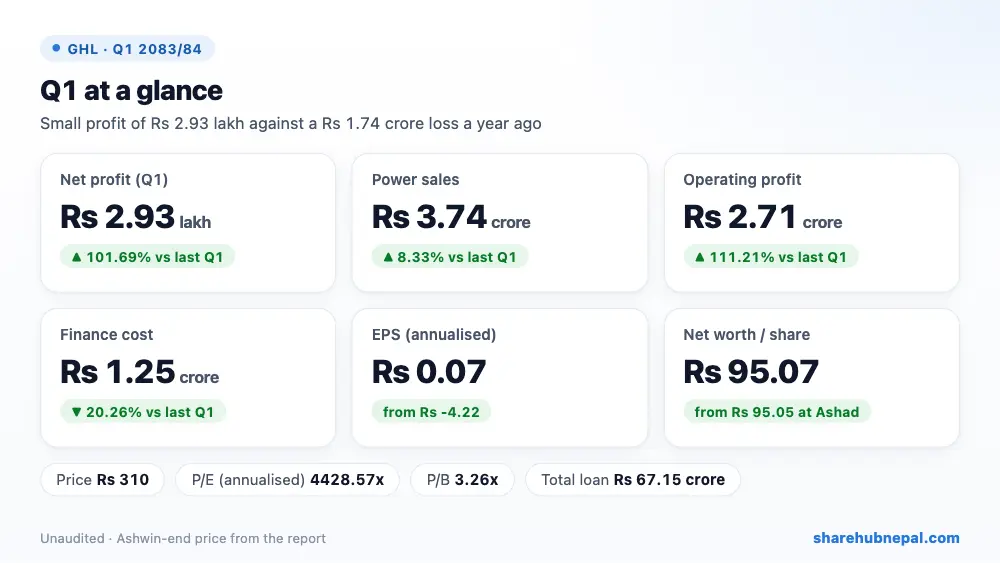
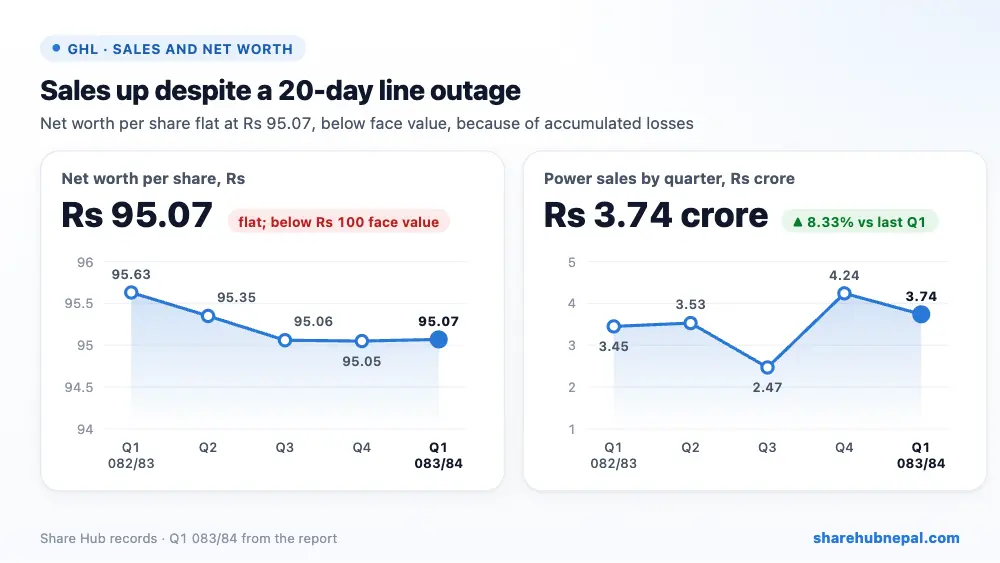
Ghalemdi Hydro made a small net profit of Rs 2.93 lakh in the first quarter of FY 2083/84, against a loss of Rs 1.74 crore in the same quarter last year. Power sales rose 8.33% to Rs 3.74 crore even though a Kaligandaki flood on 11 Ashwin 2083 damaged NEA's Dana–Kushma 220 kV line and shut the plant for about 20 days. Cost of sales fell 81.67% and finance cost 20.26%. Quarter EPS is only Rs 0.02 (annualised Rs 0.07).
| Indicator | Q1 2083/84 | Q1 2082/83 | Change |
| Revenue from sales | Rs 37,351,019 | Rs 34,479,083 | +8.33% |
| Cost of sales | Rs 3,318,094 | Rs 18,098,294 | −81.67% |
| Other income | Rs 0 | Rs 2,038,356 | −100.00% |
| Operating profit | Rs 27,093,091 | Rs 12,827,597 | +111.21% |
| Finance cost | Rs 12,492,086 | Rs 15,665,678 | −20.26% |
| Income tax | Rs 0 | Rs 509,589 | −100.00% |
| Net profit | Rs 293,389 | −Rs 17,388,073 | Turned to profit |
| EPS (annualised) | 0.07 | -4.22 | – |
| Net worth per share | 95.07 | 95.63 | – |
1. Where the profit came from
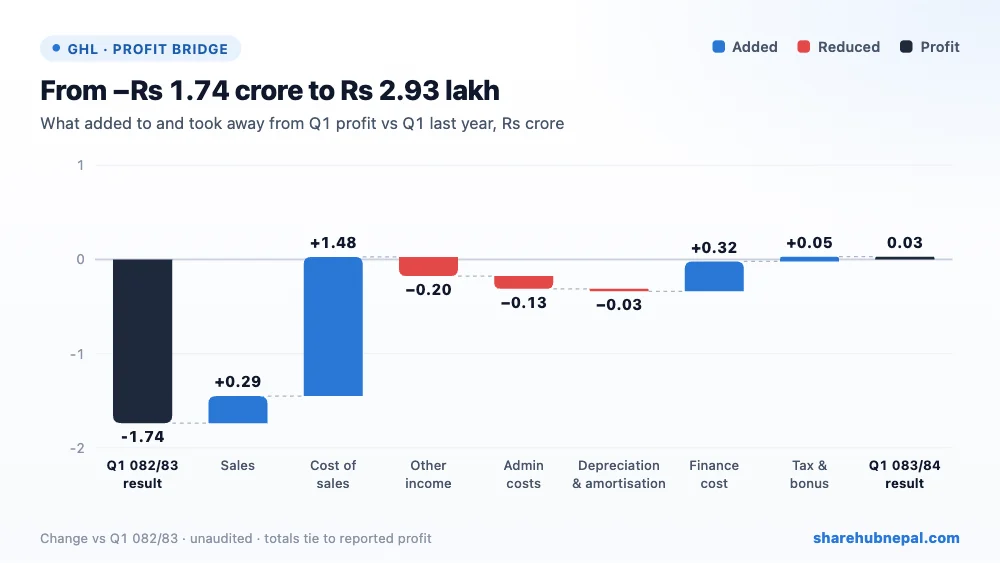
Sales added Rs 28.72 lakh, cost of sales was Rs 1.48 crore lower and finance cost Rs 31.74 lakh lower, and there was no tax this time (Rs 5.10 lakh last year). Against that, staff and admin costs rose Rs 13.48 lakh, depreciation Rs 2.67 lakh, and last year's other income of Rs 20.38 lakh did not repeat. The big drop in cost of sales is not explained in the report.
2. Profit through the year
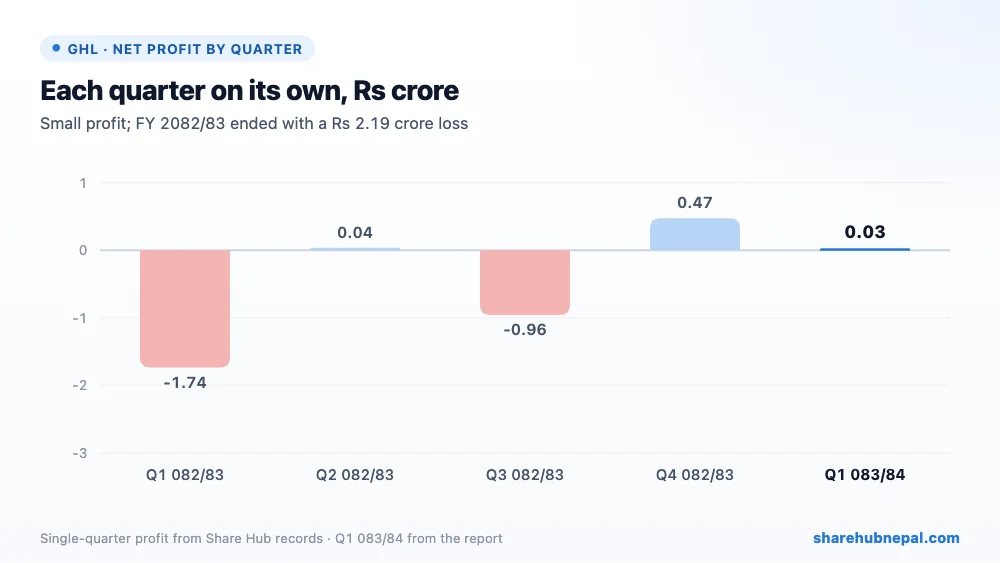
Profit by quarter (Share Hub records): Q1 082/83: −Rs 1.74 crore, Q2 082/83: Rs 3.63 lakh, Q3 082/83: −Rs 95.82 lakh, Q4 082/83: Rs 47.30 lakh, Q1 083/84: Rs 2.93 lakh. Last year GHL lost money in Q1 and Q3, made small profits in Q2 and Q4, and ended FY 2082/83 with a loss of Rs 2.19 crore (EPS Rs -1.33).
3. Debt and balance sheet
| Particulars | Ashwin 2083 | Ashad 2083 | Change |
| Total assets | Rs 2,251,173,998 | Rs 2,270,926,820 | −0.87% |
| Total equity | Rs 1,568,613,810 | Rs 1,568,320,421 | +0.02% |
| Long-term borrowings | Rs 647,605,960 | Rs 655,994,158 | −1.28% |
| Current borrowings | Rs 23,877,268 | Rs 30,000,000 | −20.41% |
| Cash and equivalents | Rs 1,320,737 | Rs 1,477,443 | −10.61% |
Equity is Rs 156.86 crore, but accumulated losses of Rs 26.29 crore keep net worth per share at Rs 95.07, below the Rs 100 face value. Debt is moderate: long-term loan Rs 64.76 crore (down from Rs 65.60 crore at Ashad) and short-term loan Rs 2.39 crore (from Rs 3 crore). A big part of the assets, Rs 92.51 crore or 41%, is an investment in Sangrila Urja Ltd., which earns no income in this report. Cash is only Rs 13.21 lakh, though the current ratio is 6.84.
4. Per-share figures and valuation
| Indicator | Value |
| EPS (annualised) | Rs 0.07 |
| Net worth per share | Rs 95.07 |
| Market price (Ashwin end) | Rs 310 |
| P/E (annualised) | 4428.57x |
| P/B | 3.26x |
At the Ashwin-end price of Rs 310, the share trades at 4428.57 times annualised EPS and 3.26 times net worth per share. At Rs 310 the share trades at 3.26 times net worth per share while annualised EPS is only Rs 0.07 (P/E 17,484.83 as printed), so the price rests on future hopes, not current earnings.
Conclusion
Positives: back in profit, sales up 8.33% despite a 20-day outage, much lower cost of sales and finance cost, loans being repaid.
Watch: profit is tiny, accumulated losses, net worth below face value, 41% of assets tied up in Sangrila Urja with no return shown, very low cash, cost-of-sales drop not explained.
Q2 is the main wet season, so a full quarter without line outages should lift profit, but GHL needs steady earnings for years to clear its losses and justify the price.
Figures are from the company's unaudited Q1 report; quarter trends use Share Hub records. This is not investment advice.

