













Hathway Investment Nepal Limited – First Quarter Analysis, FY 2083/84
Unaudited results as on Ashwin end 2083, compared with the same quarter last year (Ashwin end 2082) and with Ashad end 2083.
Summary
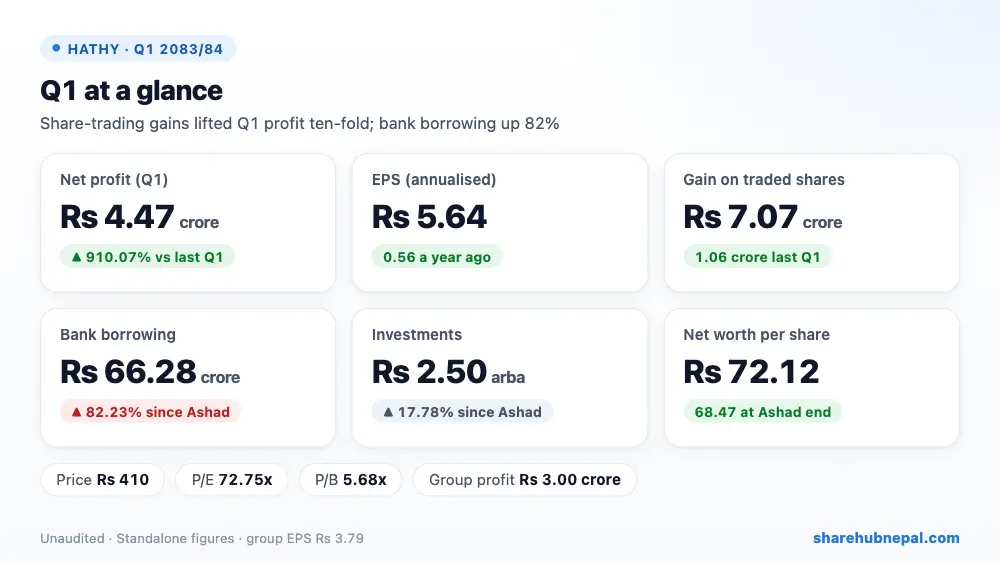
Hathway Investment Nepal earned a standalone net profit of Rs 4.47 crore in the first quarter of 2083/84, about ten times the Rs 44.23 lakh it earned a year ago. Annualised EPS is Rs 5.64 (Rs 0.56 last year) and net worth per share rose to Rs 72.12 from Rs 68.47 at Ashad end. The group, including its 90%-owned stock-dealer subsidiary, earned Rs 3.00 crore, against a loss of Rs 21.06 crore a year ago (group EPS Rs 3.79).
Almost all of the jump came from share trading: the company bought Rs 20.70 crore of shares but the value of investments it holds rose by Rs 27.77 crore, a net gain of Rs 7.07 crore against Rs 1.06 crore last year. Regular revenue (dividends and similar) was only Rs 1.01 crore. Costs rose too — interest on bank loans up 54.94% and administrative costs more than doubled — and a Rs 1.68 crore deferred tax charge took a share of the gain. A further Rs 2.17 crore fair value gain went to OCI.
| Indicator | Q1 2083/84 | Q1 2082/83 | Change |
| Revenue from operation | Rs 10,101,099 | Rs 7,664,890 | +31.78% |
| Net gain on traded investments | Rs 70,700,616 | Rs 10,571,720 | +568.77% |
| Other income | Rs 84,722 | Rs 1,149,372 | −92.63% |
| Staff and administrative expenses | Rs 7,765,292 | Rs 5,019,531 | +54.70% |
| Finance cost | Rs 10,834,890 | Rs 6,992,892 | +54.94% |
| Profit before tax | Rs 61,470,068 | Rs 6,545,930 | +839.06% |
| Tax (deferred) | Rs 16,790,730 | Rs 2,122,524 | +691.07% |
| Net profit | Rs 44,679,338 | Rs 4,423,406 | +910.07% |
| Other comprehensive income | Rs 21,674,308 | −Rs 16,044,500 | Turned to profit |
| EPS (annualised) | 5.64 | 0.56 | – |
1. Where the profit came from
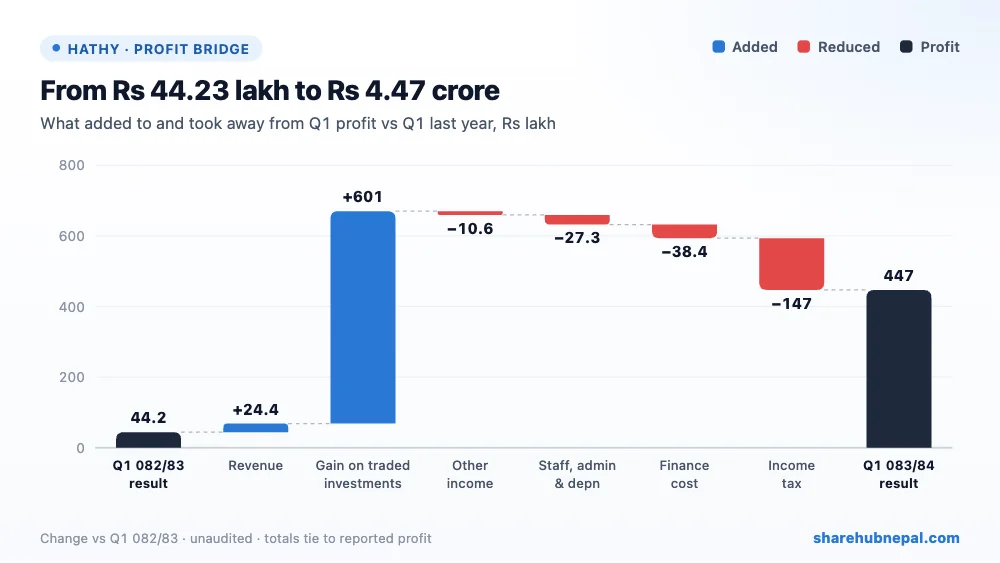
Compared with last year's Q1, the bigger net gain on traded shares added Rs 6.01 crore and higher revenue Rs 24.36 lakh. Against that, lower other income took away Rs 10.65 lakh, higher staff, admin and depreciation costs Rs 27.34 lakh, higher interest Rs 38.42 lakh and higher tax Rs 1.47 crore. The net result is Rs 4.03 crore more profit.
2. Profit through the year
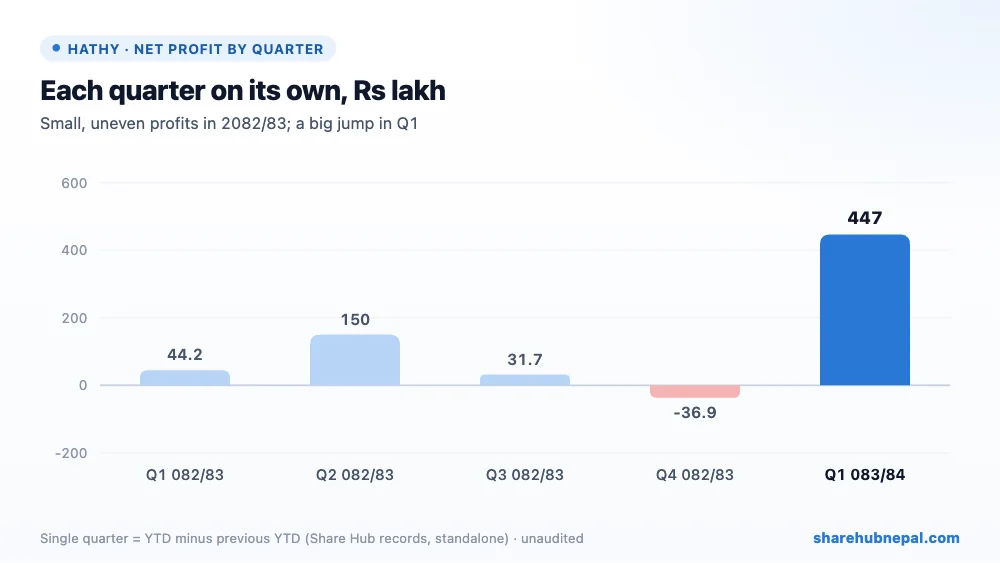
Based on Share Hub's records (standalone), single-quarter profit in 2082/83 was Rs 44.23 lakh in Q1, Rs 1.50 crore in Q2, Rs 31.67 lakh in Q3 and a loss of Rs 36.91 lakh in Q4 (full year Rs 1.89 crore). This Q1 alone earned more than twice last year's full-year profit. For an investment company, such profit moves with the share market, so it may not repeat every quarter.
3. Debt and balance sheet
| Particulars | Ashwin 2083 | Ashad 2083 | Change |
| Investment in securities | Rs 2,502,810,446 | Rs 2,124,922,387 | +17.78% |
| Other financial assets | Rs 375,357,066 | Rs 323,757,074 | +15.94% |
| Cash and cash equivalents | Rs 2,151,667 | Rs 11,409,413 | −81.14% |
| Due to banks and financial institutions | Rs 662,773,759 | Rs 363,693,852 | +82.23% |
| Fair value reserve | Rs 466,915,867 | Rs 416,462,979 | +12.11% |
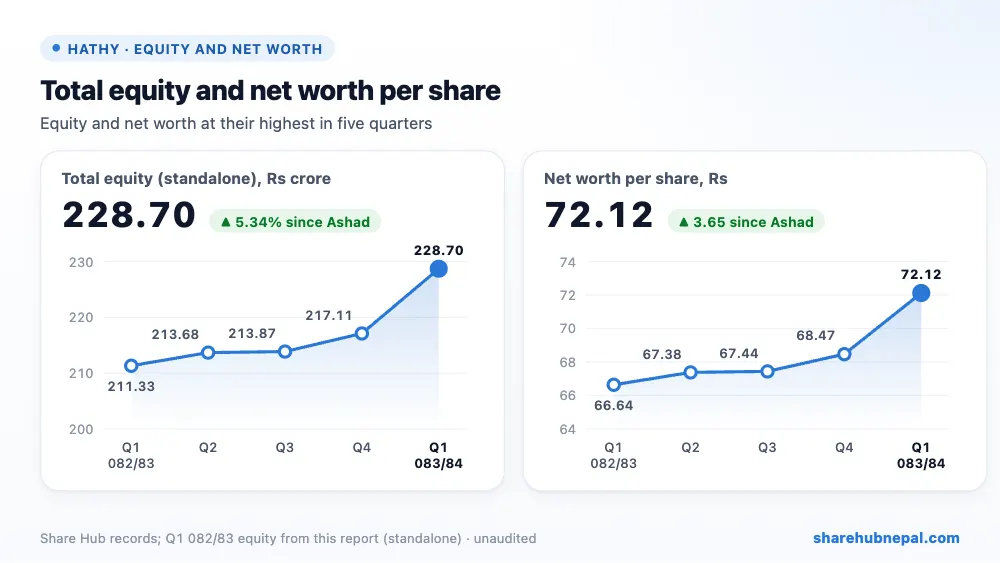
| Total equity | Rs 2,287,017,897 | Rs 2,171,141,083 | +5.34% |
| Total assets | Rs 3,145,892,556 | Rs 2,687,317,899 | +17.06% |
Total assets are Rs 3.15 arba, up from Rs 2.69 arba at Ashad end. Investments in securities rose 17.78% to Rs 2.50 arba, and investment property is Rs 18.17 crore. This growth was funded mostly by bank borrowing, which rose 82.23% to Rs 66.28 crore. Other financial assets are Rs 37.54 crore, including Rs 30.92 crore advanced to the subsidiary Hathway Stock Dealer for short-term investment. Equity is Rs 2.29 arba (paid-up capital Rs 1.59 arba, fair value reserve Rs 46.69 crore); it rose Rs 4.95 crore more than the quarter's total comprehensive income, which the report does not explain.
4. Per-share figures and valuation
| Indicator | Value |
| EPS (annualised) | Rs 5.64 |
| Group EPS (annualised) | Rs 3.79 |
| Net worth per share | Rs 72.12 |
| Total assets per share | Rs 99.20 |
| Market price (Q1 close) | Rs 410 |
| P/E | 72.75x |
| P/B | 5.68x |
The Q1 closing price was Rs 410 (range Rs 385 to Rs 785). That is 72.75 times annualised EPS and 5.68 times net worth per share. The report says there are no legal cases by or against the company or its directors.
Conclusion
Positives: profit up about ten times, net worth per share at Rs 72.12, a group profit after last year's group loss, a fair value gain in OCI, and growing investments.
Watch: profit that depends on share-market trading gains, bank borrowing up 82% with interest cost up 55%, a large advance to the subsidiary, administrative costs more than doubled, the unexplained Rs 4.95 crore jump in equity, and a P/E of about 73.
A strong quarter driven by share-market gains, partly bought with borrowed money. Good while the market is rising, but the profit can swing the other way if prices fall.
Figures are from the company's unaudited Q1 report; quarter trends use Share Hub records. This is not investment advice.

