













Himalaya Urja Bikas Company Limited – First Quarter Analysis, FY 2083/84
Unaudited results as on Ashwin end 2083, compared with the same quarter last year (Ashwin end 2082) and with Ashad end 2083.
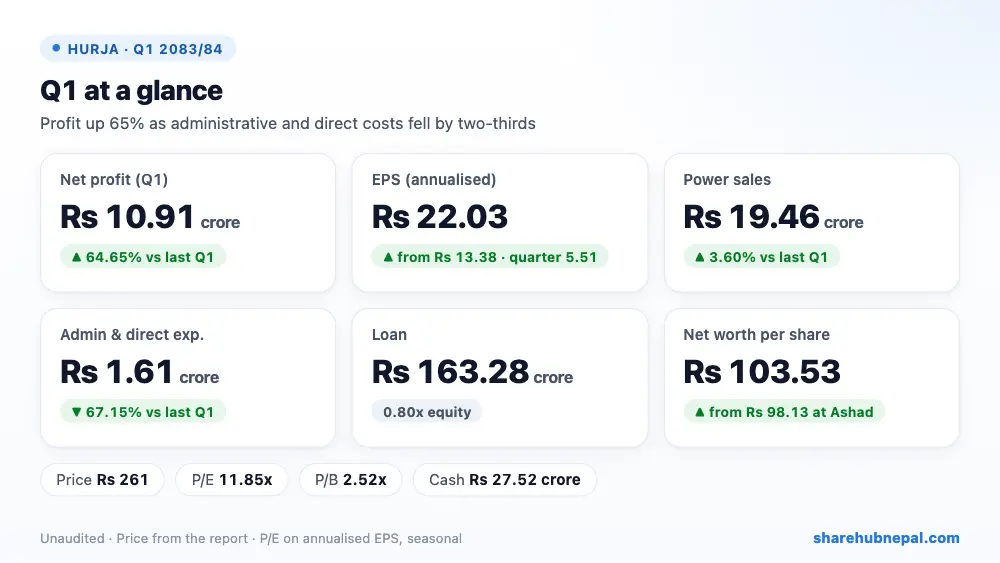
Summary
Himalaya Urja Bikas, which runs the Upallo Khimti (12 MW) and Upper Khimti-II (7 MW) projects, earned a net profit of Rs 10.91 crore in the first quarter, up 64.65% from Rs 6.62 crore a year ago. Quarter EPS is Rs 5.51 (Rs 22.03 annualised).
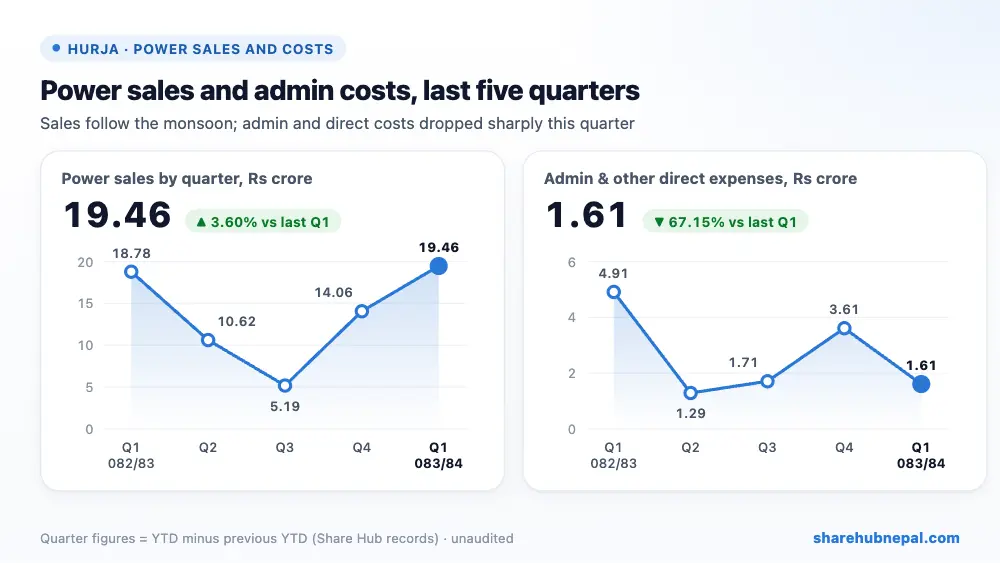
Power sales rose 3.60% to Rs 19.46 crore, but the main reason for the jump is cost: administrative and other direct expenses fell 67.15% to Rs 1.61 crore from Rs 4.91 crore (the report does not explain why). Finance cost also fell 13.38% to Rs 3.02 crore. A CSR provision of Rs 11.02 lakh was made, and no income tax was charged. The net profit margin rose to 56.05% from 35.27%.
| Indicator | Q1 2083/84 | Q1 2082/83 | Change |
| Income from power sales | Rs 194,555,595 | Rs 187,790,932 | +3.60% |
| Royalty | Rs 3,891,112 | Rs 3,755,819 | +3.60% |
| Administrative and other direct expenses | Rs 16,128,398 | Rs 49,101,268 | −67.15% |
| Operating profit | Rs 174,542,506 | Rs 134,980,341 | +29.31% |
| Finance cost | Rs 30,172,191 | Rs 34,831,985 | −13.38% |
| Depreciation | Rs 34,215,792 | Rs 33,915,929 | +0.88% |
| Net profit (after CSR) | Rs 109,052,979 | Rs 66,232,427 | +64.65% |
| EPS (annualised) | 22.03 | 13.38 | – |
1. Where the profit came from
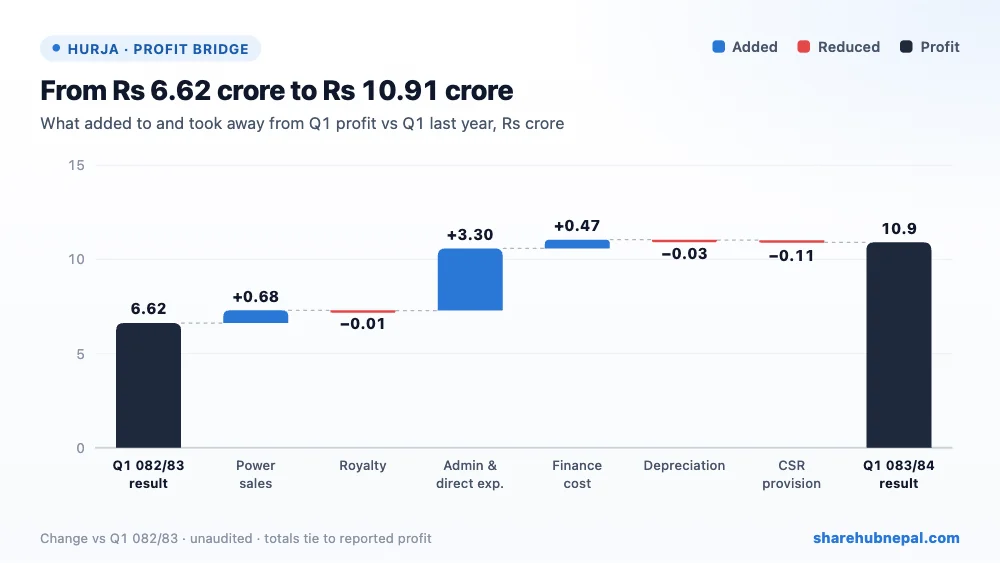
Compared with last year's Q1, lower administrative and other direct expenses added Rs 3.30 crore, higher power sales Rs 67.65 lakh and lower finance cost Rs 46.60 lakh. The CSR provision took away Rs 11.02 lakh, and higher depreciation, royalty and lower other income about Rs 4.75 lakh together.
2. Profit through the year
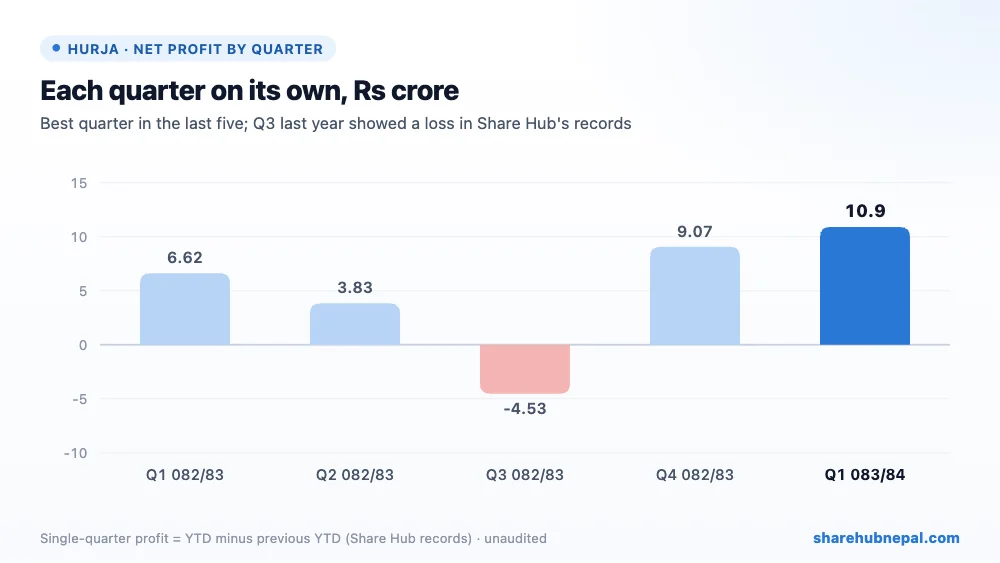
Based on Share Hub's records, single-quarter results in 2082/83 were a profit of Rs 6.62 crore in Q1, Rs 3.83 crore in Q2, a loss of Rs 4.53 crore in Q3 and a profit of Rs 9.07 crore in Q4 (full year Rs 14.99 crore). The Q3 and Q4 records do not move in a straight line (finance cost to Q4 is lower than to Q3), so the quarter split of last year should be read with care.
3. Debt and balance sheet
| Particulars | Ashwin 2083 | Ashad 2083 | Change |
| Loan | Rs 1,632,847,095 | Rs 1,637,532,082 | −0.29% |
| Property, plant and equipment (net) | Rs 3,131,974,851 | Rs 3,159,439,677 | −0.87% |
| Investment | Rs 84,500,000 | Rs 89,529,566 | −5.62% |
| Trade and other advances | Rs 195,132,788 | Rs 175,193,450 | +11.38% |
| Cash and cash equivalents | Rs 275,213,628 | Rs 166,887,830 | +64.91% |
| Total assets | Rs 3,686,833,278 | Rs 3,591,062,534 | +2.67% |
| Total equity | Rs 2,049,846,725 | Rs 1,942,978,614 | +5.50% |
The loan is Rs 163.28 crore, almost unchanged from Ashad end (Rs 163.75 crore) and 0.80 times equity. Cash rose to Rs 27.52 crore from Rs 16.69 crore, and current liabilities are only Rs 41.39 lakh, so liquidity is very strong. Equity rose to Rs 204.98 crore, about Rs 21.85 lakh less than the quarter's profit (not explained), and net worth per share rose to Rs 103.53. The company says it is investing in new hydropower projects.
4. Per-share figures and valuation
| Indicator | Value |
| EPS (quarter, as reported) | Rs 5.51 |
| EPS (annualised) | Rs 22.03 |
| Net worth per share | Rs 103.53 |
| Total assets per share | Rs 186.20 |
| Market price (report) | Rs 261.00 |
| P/E (annualised EPS) | 11.85x |
| P/B | 2.52x |
At Rs 261 the share trades at 11.85 times annualised EPS and 2.52 times net worth per share. The report's own P/E of 47.37 uses the quarter EPS of Rs 5.51. On last year's full-year EPS of Rs 7.57 the P/E is about 34.5, so the annualised figure flatters the stock.
Conclusion
Positives: profit up 64.65%, costs down sharply, power sales up 3.60%, lower interest, very strong liquidity, moderate debt (0.80x equity) and net worth back above face value.
Watch: the unexplained two-thirds fall in administrative and direct expenses (may not repeat), a seasonal Q1, a small gap between profit and the rise in equity, and investment in new projects that will need funding.
Himalaya Urja had its best quarter in more than a year. Whether the lower cost level holds will decide if the full year beats last year's Rs 14.99 crore profit.
Figures are from the company's unaudited Q1 report; quarter trends use Share Hub records. This is not investment advice.

