













Kalika Laghubitta Bittiya Sanstha Limited – First Quarter Analysis, FY 2083/84
Unaudited results as on Ashwin end 2083, compared with the same quarter last year (Ashwin end 2082) and with the year end (Ashad end 2083).
Summary
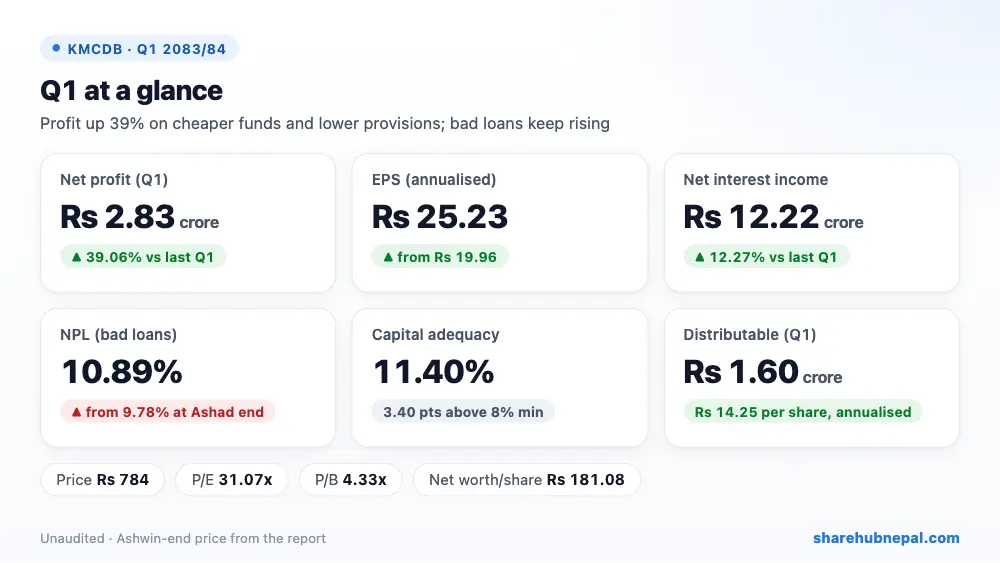
Kalika Laghubitta earned a net profit of Rs 2.83 crore in the first quarter, up 39.06% from Rs 2.03 crore in the same quarter last year. EPS is Rs 25.23 against Rs 19.96.
Compared with last year, the biggest help came from net interest income (+Rs 1.34 crore) and fees & commission (+Rs 57.59 lakh), while the biggest drag was staff cost (−Rs 87.60 lakh).
Kalika Laghubitta's first-quarter net profit rose 39.06% to Rs 2.83 crore from Rs 2.03 crore a year ago. Cost of funds fell to 5.62% from 6.96%, so interest expense fell 3.95% while interest income rose 5.78%, lifting net interest income 12.27% to Rs 12.22 crore. Fee and commission income rose 44.91% to Rs 1.86 crore and the loan-loss charge fell 23.39% to Rs 91.57 lakh. Staff cost rose 13.56% to Rs 7.34 crore and tax rose with profit.
| Indicator | Q1 2083/84 | Q1 2082/83 | Change |
| Net profit | Rs 28,284,733 | Rs 20,340,043 | +39.06% |
| Net interest income | Rs 122,230,714 | Rs 108,870,805 | +12.27% |
| Net fee and commission income | Rs 18,579,958 | Rs 12,821,250 | +44.92% |
| Impairment charge/(reversal) | Rs 9,157,103 | Rs 11,953,159 | −23.39% |
| Operating profit | Rs 40,268,685 | Rs 29,013,248 | +38.79% |
| EPS | Rs 25.23 | Rs 19.96 | – |
| Net worth per share | Rs 181.08 | Rs 191.51 | −5.45% |
| NPL | 10.89% | 6.40% | +4.49 pts |
| Capital adequacy | 11.40% | 12.35% | −0.95 pts |
1. Where the profit came from
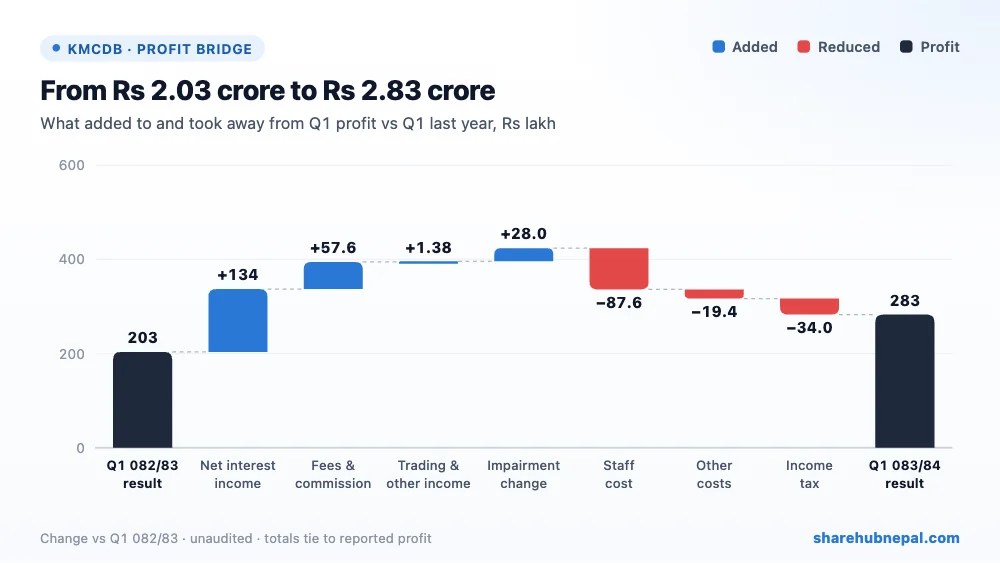
The bridge chart shows how Q1 profit moved from last year's Rs 2.03 crore to this year's Rs 2.83 crore:
- Net interest income (+Rs 1.34 crore): interest income rose 5.78% while interest expense fell 3.95%.
- Staff cost (−Rs 87.60 lakh): personnel expenses rose 13.56% to Rs 7.34 crore.
- Fees & commission (+Rs 57.59 lakh): net fee income was Rs 1.86 crore against Rs 1.28 crore.
- Income tax (−Rs 34.05 lakh): tax was Rs 1.21 crore against Rs 87.17 lakh last year.
- Impairment (+Rs 27.96 lakh): the bank set aside Rs 91.57 lakh for loan losses, against Rs 1.20 crore last year.
- Other costs (−Rs 19.43 lakh): other operating expenses, depreciation and non-operating items combined.
- Trading & other income (+Rs 1.38 lakh): trading income and other operating income combined.
In plain terms: operating costs took 65.0% of operating income, against 66.4% a year ago. Impairment took 6.5% of operating income.
2. Profit through the year
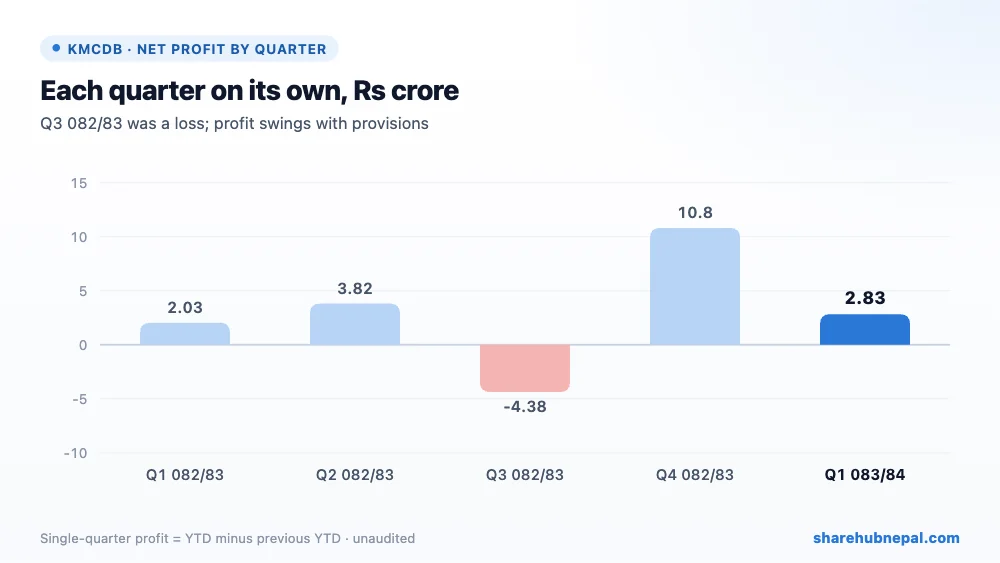
Looking at each quarter on its own (year-to-date profit minus the previous quarter's): Q1 082/83: Rs 2.03 crore; Q2 082/83: Rs 3.82 crore; Q3 082/83: −Rs 4.38 crore; Q4 082/83: Rs 10.82 crore; Q1 083/84: Rs 2.83 crore.
Based on Share Hub's records, single-quarter results in 2082/83 were profits of Rs 2.03 crore in Q1 and Rs 3.82 crore in Q2, a loss of Rs 4.38 crore in Q3 and a profit of Rs 10.82 crore in Q4 (full year Rs 12.29 crore). This Q1 is better than last year's, but provisions have made results swing a lot from quarter to quarter.
3. Deposits, loans and liquidity
| Particulars | Ashwin 2083 | Ashad 2083 | Change |
| Deposits from customers | Rs 2,112,911,101 | Rs 2,036,909,234 | +3.73% |
| Loans and advances to customers | Rs 5,589,039,044 | Rs 5,340,691,974 | +4.65% |
| Cash and cash equivalent | Rs 191,795,705 | Rs 245,430,851 | −21.85% |
| Balance with Nepal Rastra Bank | Rs 25,672,750 | Rs 25,672,750 | +0.00% |
| Investment securities | Rs 2,000,000 | Rs 2,000,000 | +0.00% |
| Total assets | Rs 5,982,349,694 | Rs 5,785,271,892 | +3.41% |
| Total equity | Rs 812,070,341 | Rs 801,542,665 | +1.31% |
In the quarter, deposits grew 3.73% and customer loans grew 4.65%. The credit-to-deposit ratio is 115.92% (116.15% a year ago).
Pricing: cost of funds 5.62% (from 6.96%), base rate 12.95% (from 14.47%), interest spread 8.89% (from 8.08%).
Loans grew 4.65% in the quarter to Rs 5.59 arba, deposits 3.73% to Rs 2.11 arba and borrowings 3.51% to Rs 2.89 arba. Cash fell to Rs 19.18 crore from Rs 24.54 crore as lending picked up. The base rate fell to 12.95% from 14.47% a year ago, and the spread is 8.89%. Kalika works in 50 districts through 112 branches; it gave loans to 30,196 members this quarter. Equity rose Rs 1.05 crore, Rs 1.78 crore less than the profit (reserves fell; the report does not explain why).
4. Bad loans and capital
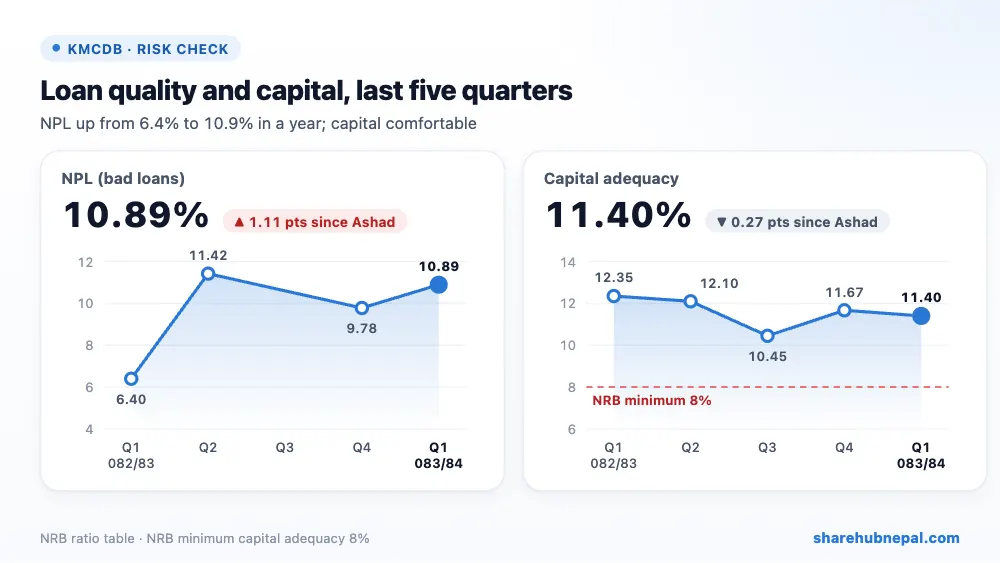
- NPL is 10.89%, against 9.78% at Ashad end and 6.40% a year ago. Loan-loss provisions cover 47.03% of bad loans (56.47% a year ago).
- Capital adequacy is 11.40%, against 11.67% at Ashad end and 12.35% a year ago. NRB's minimum is 8%, so the buffer is 3.40 points.
- Bad loans are rising. NPL is 10.89%, up from 9.78% at Ashad end and 6.40% a year ago, and provisions cover 47.03% of these loans (56.47% a year ago). Note that loans covered by the Deposit and Credit Guarantee Fund need less provision, which helped this quarter. Capital adequacy is 11.40%, a comfortable 3.40 points above the 8% minimum. The report also mentions two staff convicted in a financial misappropriation case.
5. Distributable profit
| Particulars (Rs) | Amount |
| Net profit for the quarter | 28,284,733 |
| Less: general reserve | (5,656,947) |
| Less: CSR fund | (282,847) |
| Less: client protection fund | (565,695) |
| Less: regulatory reserve | (5,807,683) |
| Q1 distributable profit | 15,971,561 |
After the reserves and a Rs 58.08 lakh transfer to the regulatory reserve, Q1 distributable profit is Rs 1.60 crore, or Rs 14.25 per share on an annualised basis. Retained earnings are Rs 13.36 crore.
6. Per-share figures and valuation
| Indicator | Value |
| EPS (as reported) | Rs 25.23 |
| Net worth per share | Rs 181.08 |
| Distributable EPS | Rs 14.25 |
| Closing price, Ashwin end 2083 | Rs 784.00 |
| Price range during the quarter | Rs 735.00 – Rs 884.90 |
| P/E (annualised EPS) | 31.1x |
| Price to book | 4.33x |
At Rs 784 the share trades at 31.07 times annualised EPS and 4.33 times net worth per share. That is a rich price for a microfinance whose bad loans have risen by more than 4 points in a year.
Conclusion
Positives: profit up 39%, cheaper funds and lower base rate, growing loans and deposits, higher fee income, lower provision charge, and comfortable capital of 11.40%.
Watch points: NPL rising to 10.89% with less than half covered by provisions, staff costs growing faster than income, the unexplained fall in reserves, a P/E above 31, and the wider stress in the microfinance sector (weak repayment culture, members moving away, economic slowdown).
A good profit quarter for Kalika, helped by cheaper funds and lower provisions. The weak spot is rising bad loans; if NPL keeps climbing, provisions will eat into these gains.
Based on the company's unaudited first-quarter report. Figures may change after audit or regulator review. This is not investment advice.

