













Modi Energy Limited – First Quarter Analysis, FY 2083/84
Unaudited results as on Ashwin end 2083, compared with the same quarter last year (Ashwin end 2082) and with Ashad end 2083.
Summary
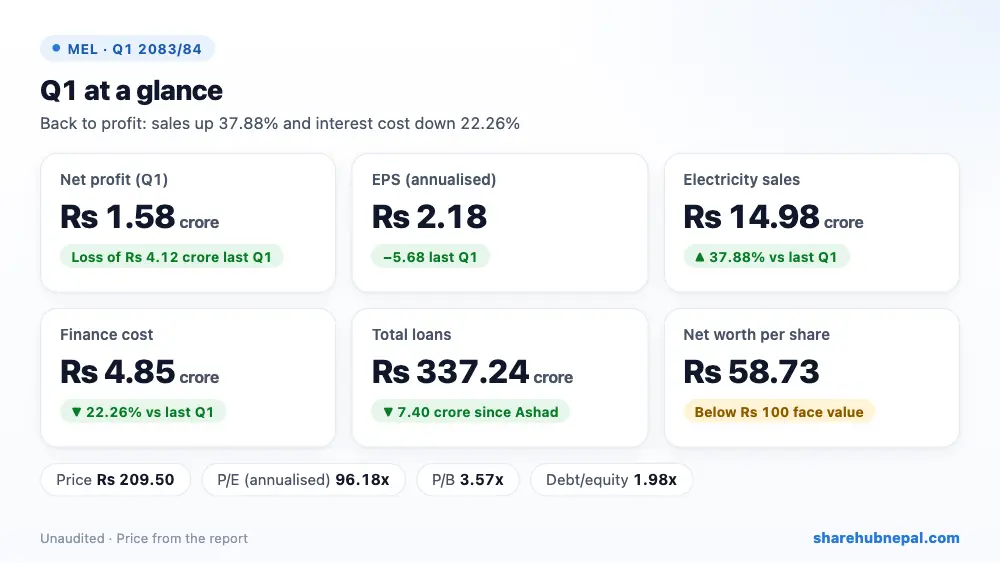
Modi Energy (Lower Modi hydroelectric project, generating since Ashoj 2078) made a net profit of Rs 1.58 crore in the first quarter, against a loss of Rs 4.12 crore a year ago. Annualised EPS is Rs 2.18.
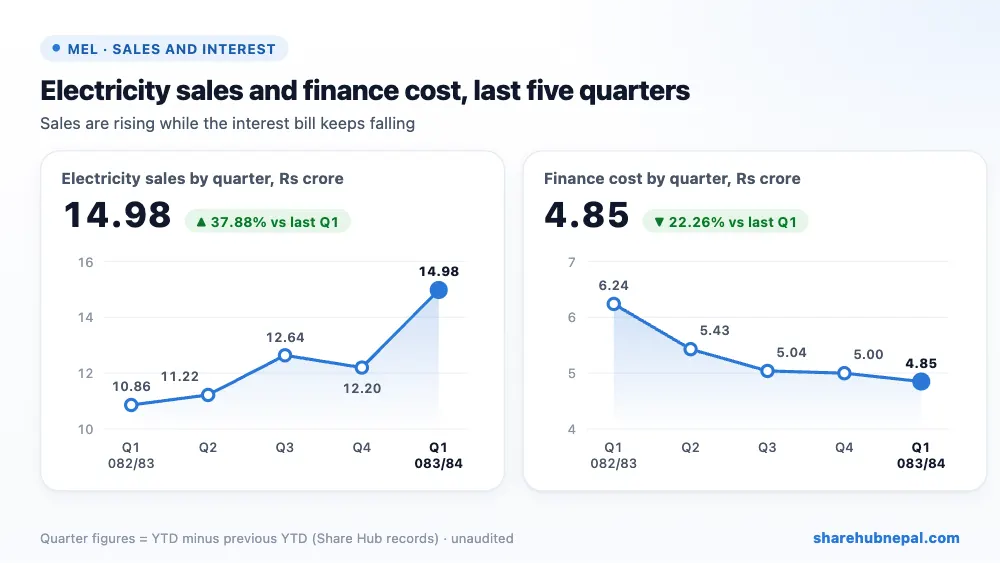
Electricity sales rose 37.88% to Rs 14.98 crore and finance cost fell 22.26% to Rs 4.85 crore as loans were paid down. Plant and administrative costs were slightly lower and depreciation was flat at Rs 6.70 crore. The report is in Rs thousand; there was no tax or bonus.
| Indicator | Q1 2083/84 | Q1 2082/83 | Change |
| Electricity sales | Rs 149,763,000 | Rs 108,617,000 | +37.88% |
| Gross profit | Rs 132,323,000 | Rs 89,465,000 | +47.90% |
| Operating profit (before interest and depreciation) | Rs 131,236,000 | Rs 88,368,000 | +48.51% |
| Finance cost | Rs 48,487,000 | Rs 62,372,000 | −22.26% |
| Depreciation | Rs 66,958,000 | Rs 67,164,000 | −0.31% |
| Net profit/(loss) | Rs 15,791,000 | −Rs 41,168,000 | Turned to profit |
| EPS (annualised) | 2.18 | -5.68 | – |
1. Where the profit came from
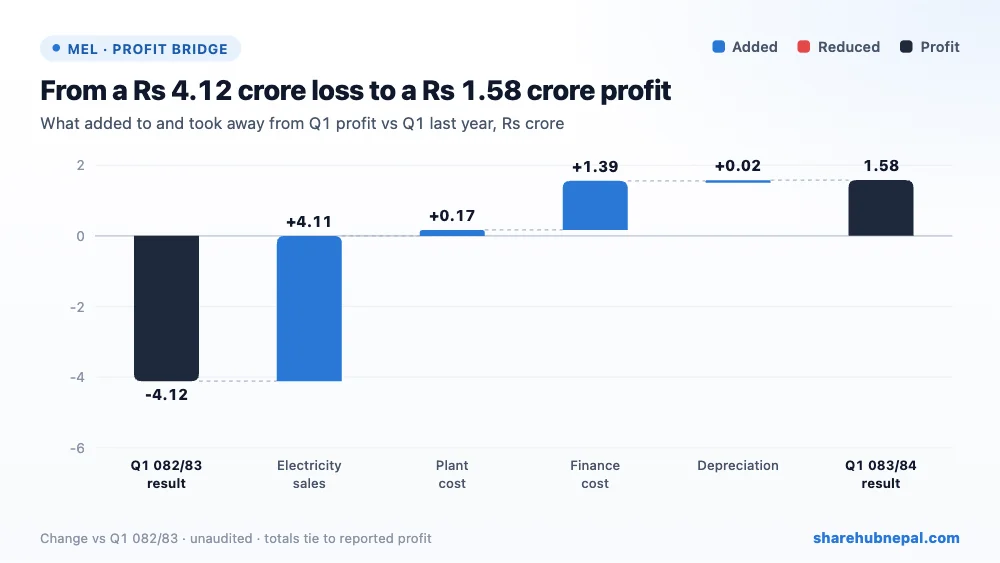
Compared with last year's Q1, higher electricity sales added Rs 4.11 crore and lower finance cost Rs 1.39 crore. Lower plant costs added Rs 17.13 lakh, lower depreciation Rs 2.06 lakh and lower administrative cost Rs 9,000, turning a Rs 4.12 crore loss into a Rs 1.58 crore profit.
2. Profit through the year
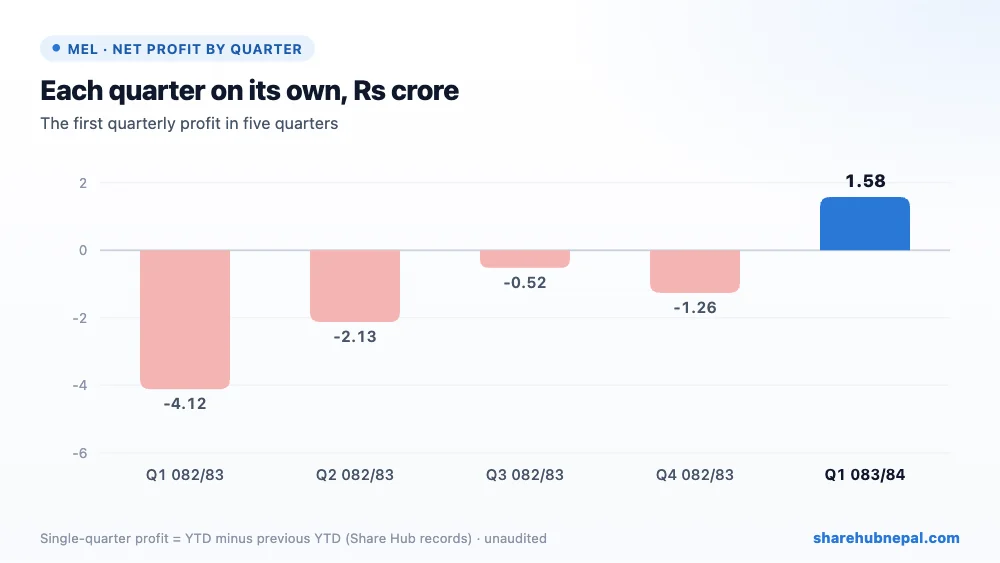
Based on Share Hub's records (Q3 corrected in this update), Modi Energy lost money in every quarter of 2082/83: Rs 4.12 crore in Q1, Rs 2.13 crore in Q2, Rs 52.15 lakh in Q3 and Rs 1.26 crore in Q4, for a full-year loss of Rs 8.03 crore. This Q1 is its first quarterly profit in five quarters.
3. Debt and balance sheet
| Particulars | Ashwin 2083 | Ashad 2083 | Change |
| Long-term loan | Rs 3,007,419,000 | Rs 3,057,422,000 | −1.64% |
| Short-term loan | Rs 365,000,000 | Rs 389,000,000 | −6.17% |
| Intangible (project) assets | Rs 5,030,317,000 | Rs 5,095,539,000 | −1.28% |
| Current assets | Rs 200,919,000 | Rs 194,918,000 | +3.08% |
| Total assets | Rs 5,239,862,000 | Rs 5,299,517,000 | −1.13% |
| Total equity | Rs 1,703,229,000 | Rs 1,687,416,000 | +0.94% |
Total loans fell Rs 7.40 crore in the quarter to Rs 337.24 crore (long-term Rs 300.74 crore, short-term Rs 36.50 crore), 1.98 times equity. The current ratio is only 0.38: current liabilities of Rs 52.27 crore are well above current assets of Rs 20.09 crore. Accumulated losses of Rs 119.68 crore keep net worth per share (Rs 58.73) well below the Rs 100 face value.
4. Per-share figures and valuation
| Indicator | Value |
| EPS (annualised) | Rs 2.18 |
| Net worth per share | Rs 58.73 |
| Market price (report) | Rs 209.50 |
| P/E (as reported) | 96.18x |
| P/B | 3.57x |
| Current ratio | 0.38 |
| ROA (annualised) | 1.21% |
At Rs 209.50 the share trades at 96.18 times annualised EPS and 3.57 times net worth per share. Because a full year includes loss-making dry-season quarters, annualising Q1 overstates the earning power; last year ended in a loss.
Conclusion
Positives: a return to profit, sales up 37.88%, finance cost down 22.26%, loans being repaid, and lower operating costs.
Watch: high debt (1.98 times equity), a very low current ratio (0.38), accumulated losses of Rs 119.68 crore, loss-making dry-season quarters, and a high P/E.
Modi Energy finally made a quarterly profit thanks to more power sales and a smaller interest bill. It still has to show it can stay profitable through the dry season and clear its accumulated losses.
Figures are from the company's unaudited Q1 report; quarter trends use Share Hub records. This is not investment advice.

