













Mount Everest Power Development Ltd. – First Quarter Analysis, FY 2083/84
Unaudited results as on Ashwin end 2083, compared with the same quarter last year (Ashwin end 2082) and with Ashad end 2083.
Summary
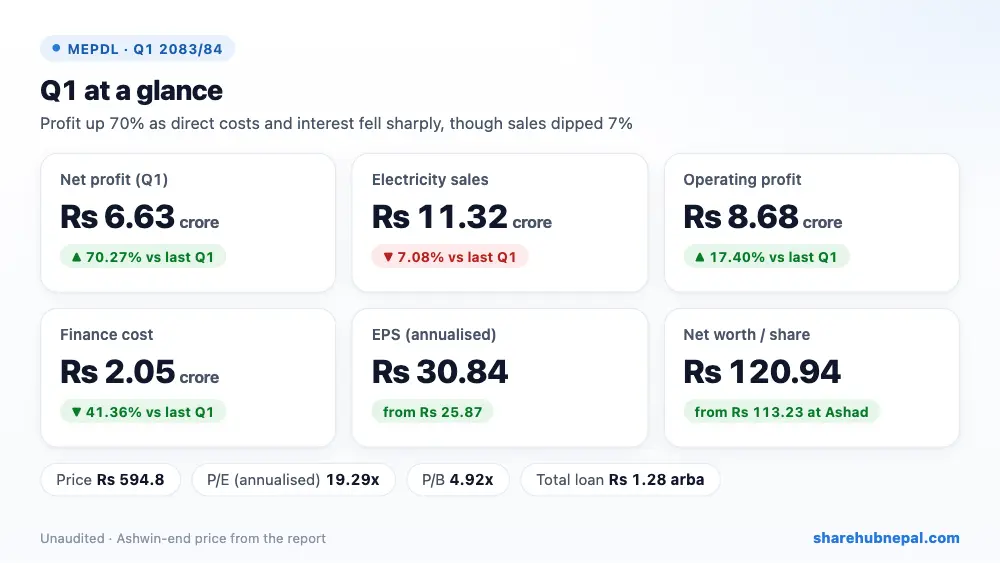
Mount Everest Power Development (Dudhkunda Khola) earned Rs 6.63 crore in the first quarter, up 70.27% from Rs 3.89 crore a year ago. Electricity sales fell 7.08% to Rs 11.32 crore, but direct expenses dropped from Rs 2.66 crore to Rs 63.90 lakh and finance cost fell 41.36% to Rs 2.05 crore after loan repayment and lower rates. The company pays no income tax yet. Its shares were listed on NEPSE on 26 Shrawan 2083. Annualised EPS is Rs 30.84.
| Indicator | Q1 2083/84 | Q1 2082/83 | Change |
| Revenue from sales | Rs 113,197,864 | Rs 121,818,373 | −7.08% |
| Cost of sales | Rs 6,390,401 | Rs 26,559,285 | −75.94% |
| Other income | Rs 2,507,076 | Rs 0 | – |
| Operating profit | Rs 86,836,089 | Rs 73,963,241 | +17.40% |
| Finance cost | Rs 20,540,377 | Rs 35,026,734 | −41.36% |
| Income tax | Rs 0 | Rs 0 | – |
| Net profit | Rs 66,295,712 | Rs 38,936,507 | +70.27% |
| EPS (annualised) | 30.84 | 25.87 | – |
| Net worth per share | 120.94 | 108.31 | – |
1. Where the profit came from
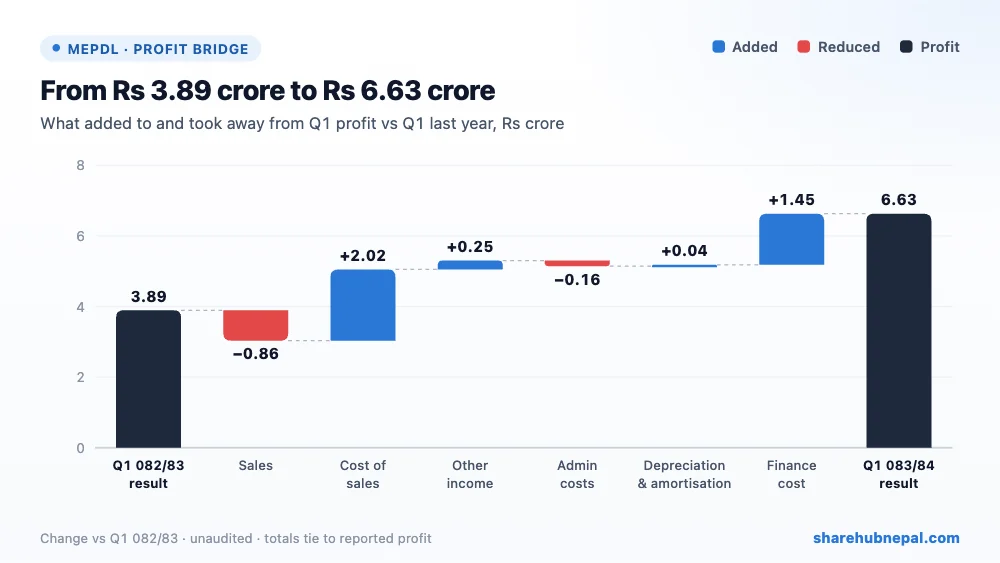
Lower direct expenses added Rs 2.02 crore and lower finance cost Rs 1.45 crore; other income added Rs 25.07 lakh. Lower sales took away Rs 86.21 lakh and staff and other operating costs Rs 15.78 lakh. The report does not explain why direct expenses fell so much; if last year included one-off repairs, part of this gain may not repeat. NEA dispatch instructions sometimes stop the plant from running at full capacity.
2. Profit through the year
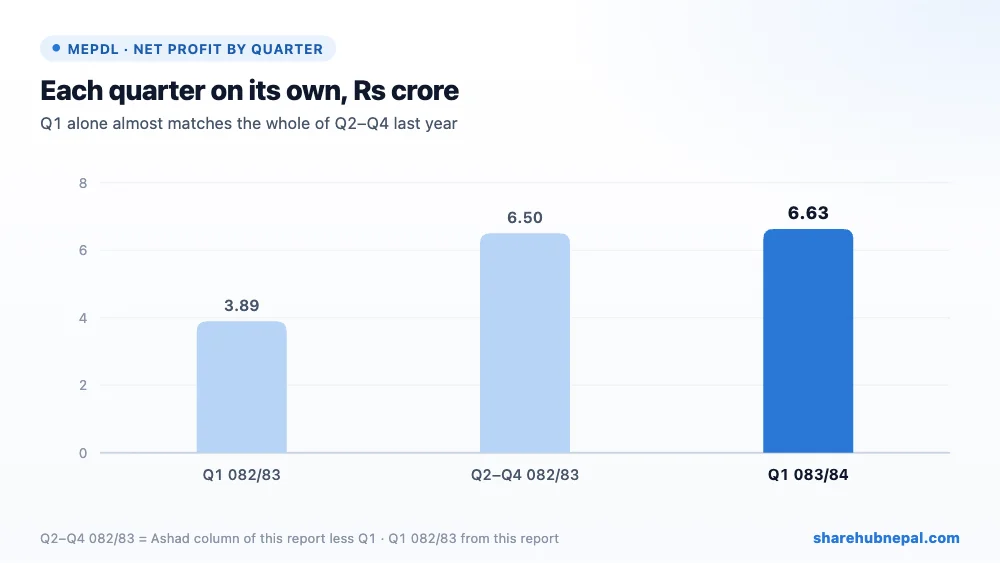
Profit by quarter (Share Hub records): Q1 082/83: Rs 3.89 crore, Q2–Q4 082/83: Rs 6.50 crore, Q1 083/84: Rs 6.63 crore. By this report, the full FY 2082/83 profit was Rs 10.39 crore, so this one quarter already earned 64% of last year's total. Share Hub's Q4 record shows Rs 8.68 crore for the year; the gap is noted for review.
3. Debt and balance sheet
| Particulars | Ashwin 2083 | Ashad 2083 | Change |
| Total assets | Rs 2,331,158,295 | Rs 2,297,273,679 | +1.47% |
| Total equity | Rs 1,040,045,711 | Rs 973,749,999 | +6.81% |
| Long-term borrowings | Rs 1,270,812,500 | Rs 1,273,783,500 | −0.23% |
| Current borrowings | Rs 13,300,000 | Rs 42,300,000 | −68.56% |
| Cash and equivalents | Rs 487,010 | Rs 2,304,790 | −78.87% |
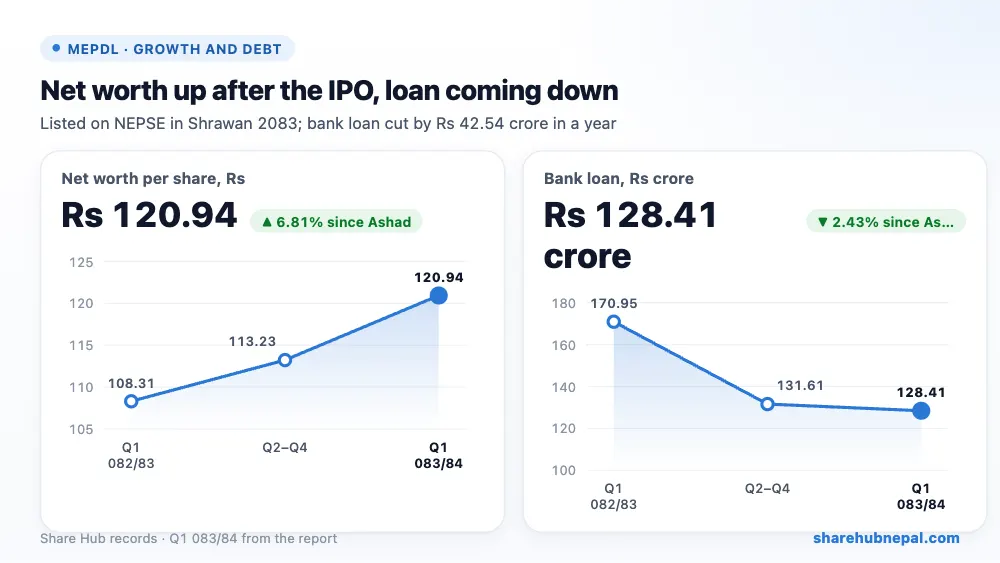
Equity is Rs 104.00 crore after the IPO raised paid-up capital to Rs 86 crore. The long-term loan is Rs 127.08 crore and short-term borrowing fell from Rs 4.23 crore to Rs 1.33 crore, so debt is now about 1.2 times equity (2.6 times a year ago). Cash is very low at Rs 4.87 lakh, while loans and advances given rose to Rs 8.47 crore. Current ratio is 4.20.
4. Per-share figures and valuation
| Indicator | Value |
| EPS (annualised) | Rs 30.84 |
| Net worth per share | Rs 120.94 |
| Market price (Ashwin end) | Rs 594.8 |
| P/E (annualised) | 19.29x |
| P/B | 4.92x |
At the Ashwin-end price of Rs 594.8, the share trades at 19.29 times annualised EPS and 4.92 times net worth per share. Q1 is the peak season, so the annualised P/E flatters the stock; on the report's FY 2082/83 profit (EPS about Rs 12.09) the P/E would be about 49x.
Conclusion
Positives: profit up 70%, much lower direct and interest costs, debt falling, net worth per share up to Rs 120.94, no tax.
Watch: sales down 7% in the peak season, unexplained fall in direct costs, NEA dispatch limits, very little cash, and a Q4 record that does not match the report.
A strong first quarter for a newly listed company. Watch whether low direct costs last and whether sales recover in the dry season.
Figures are from the company's unaudited Q1 report; quarter trends use Share Hub records. This is not investment advice.

