













Nepal Life Insurance Company Limited – First Quarter Analysis, FY 2083/84
Unaudited results as on Ashwin end 2083, compared with the same quarter last year (Ashwin end 2082) and with Ashad end 2083.
Summary
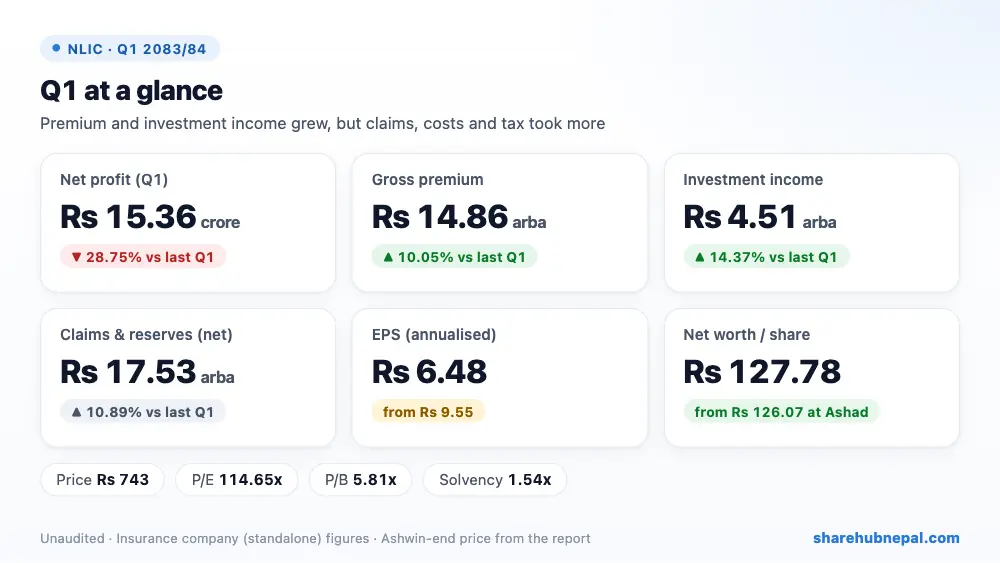
Nepal Life Insurance (standalone) earned Rs 15.36 crore in the first quarter of FY 2083/84, down 28.75% from Rs 21.56 crore a year ago. Gross premium grew 10.05% to Rs 14.86 arba and income from investments and loans rose 14.37% to Rs 4.51 arba, but claims and the build-up of policy reserves grew faster, other operating expenses tripled and income tax took Rs 88.47 crore. Annualised EPS is Rs 6.48 against Rs 9.55. The group, including its subsidiaries, earned Rs 19.29 crore.
| Indicator | Q1 2083/84 | Q1 2082/83 | Change |
| Gross earned premium | Rs 14,861,020,496 | Rs 13,503,857,311 | +10.05% |
| Net earned premium | Rs 14,716,463,919 | Rs 13,369,207,311 | +10.08% |
| Income from investments and loans | Rs 4,505,148,245 | Rs 3,939,268,018 | +14.37% |
| Interest on policyholder loans | Rs 960,004,540 | Rs 951,793,553 | +0.86% |
| Net benefits, claims and reserve change | Rs 17,532,677,022 | Rs 15,811,526,819 | +10.89% |
| Commission expenses | Rs 1,078,350,761 | Rs 960,484,926 | +12.27% |
| Other operating expenses | Rs 248,150,581 | Rs 81,954,318 | +202.79% |
| Income tax | Rs 884,652,530 | Rs 864,837,721 | +2.29% |
| Net profit | Rs 153,581,181 | Rs 215,551,664 | −28.75% |
| EPS (annualised) | 6.48 | 9.55 | – |
| Net worth per share | 127.78 | 138.14 | – |
1. Where the profit came from
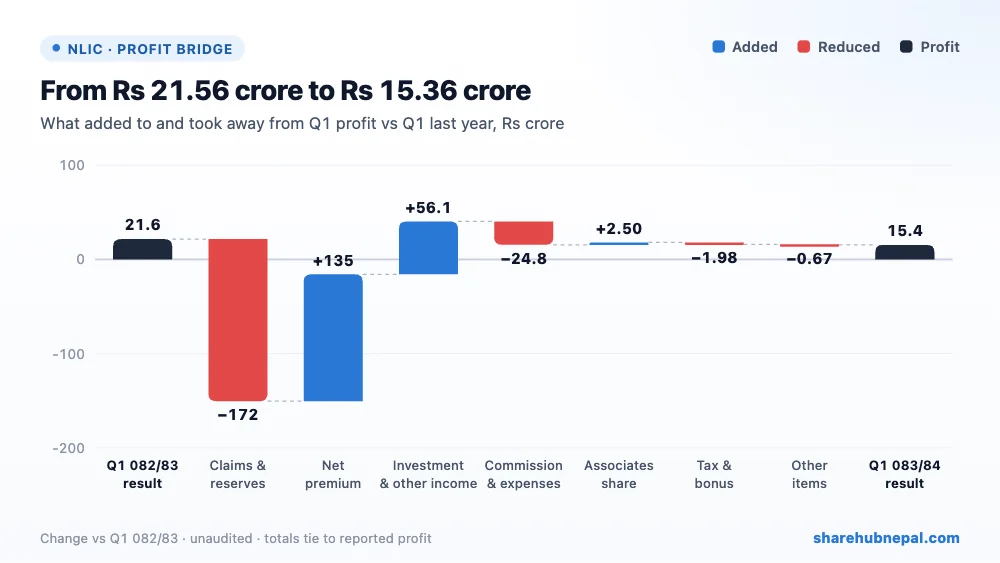
Higher net premium added Rs 1.35 arba and higher investment and other income Rs 56.13 crore. But net claims and the change in policy reserves rose Rs 1.72 arba, commission and other expenses Rs 24.78 crore (other operating expenses went from Rs 8.20 crore to Rs 24.82 crore), and tax Rs 1.98 crore. The share of associates' profit added Rs 2.50 crore. The management expense ratio rose to 3.62% from 3.04%.
2. Profit through the year
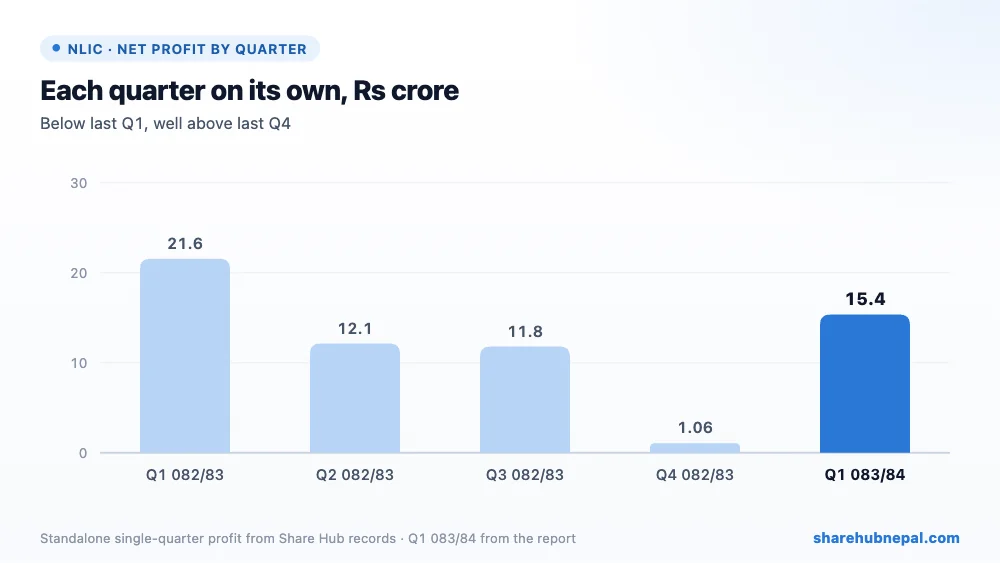
Profit by quarter (Share Hub records): Q1 082/83: Rs 21.56 crore, Q2 082/83: Rs 12.14 crore, Q3 082/83: Rs 11.80 crore, Q4 082/83: Rs 1.06 crore, Q1 083/84: Rs 15.36 crore. Life insurance profit is lumpy and depends on actuarial reserve changes; FY 2082/83 EPS was Rs 4.91.
3. Debt and balance sheet
| Particulars | Ashwin 2083 | Ashad 2083 | Change |
| Total assets | Rs 303,905,376,446 | Rs 292,098,602,285 | +4.04% |
| Investments (financial) | Rs 248,867,594,431 | Rs 241,937,167,590 | +2.86% |
| Loans to policyholders | Rs 35,044,791,559 | Rs 34,676,394,682 | +1.06% |
| Gross insurance contract liabilities | Rs 288,434,017,385 | Rs 276,134,693,543 | +4.45% |
| Total equity | Rs 12,114,259,924 | Rs 11,951,944,420 | +1.36% |
| Cash and equivalents | Rs 8,602,720,916 | Rs 3,975,782,863 | +116.38% |
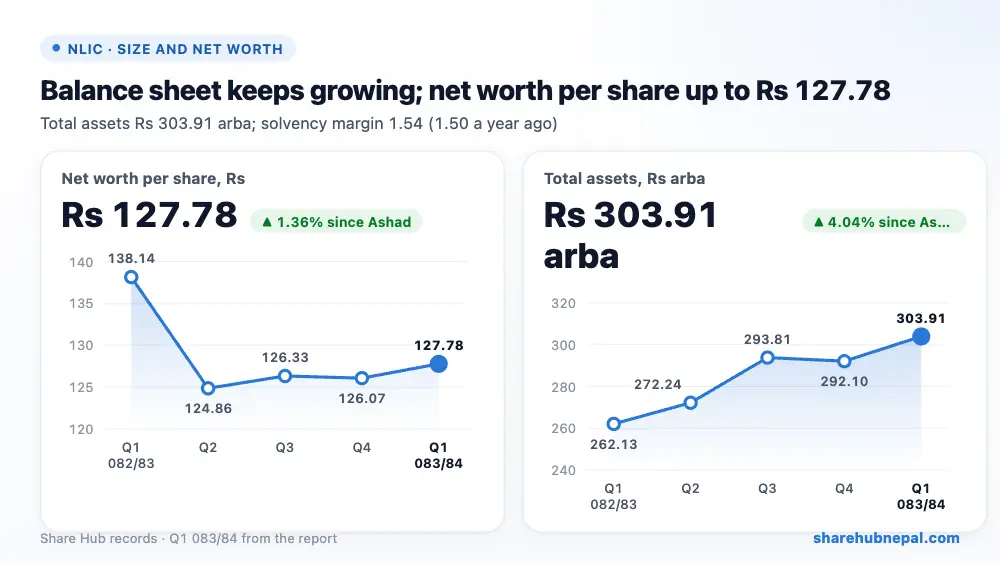
Total assets grew to Rs 303.91 arba from Rs 292.10 arba at Ashad end, mostly investments of Rs 248.87 arba and policyholder loans of Rs 35.04 arba. The life insurance fund behind policies (gross contract liabilities) is Rs 288.43 arba. Equity is Rs 12.11 arba, and the solvency margin is 1.54 against 1.50 a year ago. The company issued 275,621 policies in the quarter (92,093 a year ago), and in-force policies reached 2,179,871.
4. Per-share figures and valuation
| Indicator | Value |
| EPS (annualised) | Rs 6.48 |
| Net worth per share | Rs 127.78 |
| Market price (Ashwin end) | Rs 743 |
| P/E (annualised) | 114.66x |
| P/B | 5.81x |
At the Ashwin-end price of Rs 743, the share trades at 114.66 times annualised EPS and 5.81 times net worth per share. That is a very high P/E; the price relies on long-term growth of the business rather than current profit.
Conclusion
Positives: gross premium up 10%, investment income up 14%, many more new policies, solvency up to 1.54, OCI gain of Rs 9.01 crore.
Watch: profit down 29%, other operating expenses three times last year, higher management expense ratio, a very high tax charge relative to profit, and a P/E above 100.
The business is growing well, but profit fell on higher reserves, costs and tax. Watch whether cost growth slows in the next quarters.
Figures are from the company's unaudited Q1 report; quarter trends use Share Hub records. This is not investment advice.

