













Nepal Telecom – First Quarter Analysis, FY 2083/84
Unaudited results as on Ashwin end 2083, compared with the same quarter last year (Ashwin end 2082) and with Ashad end 2083.
Summary
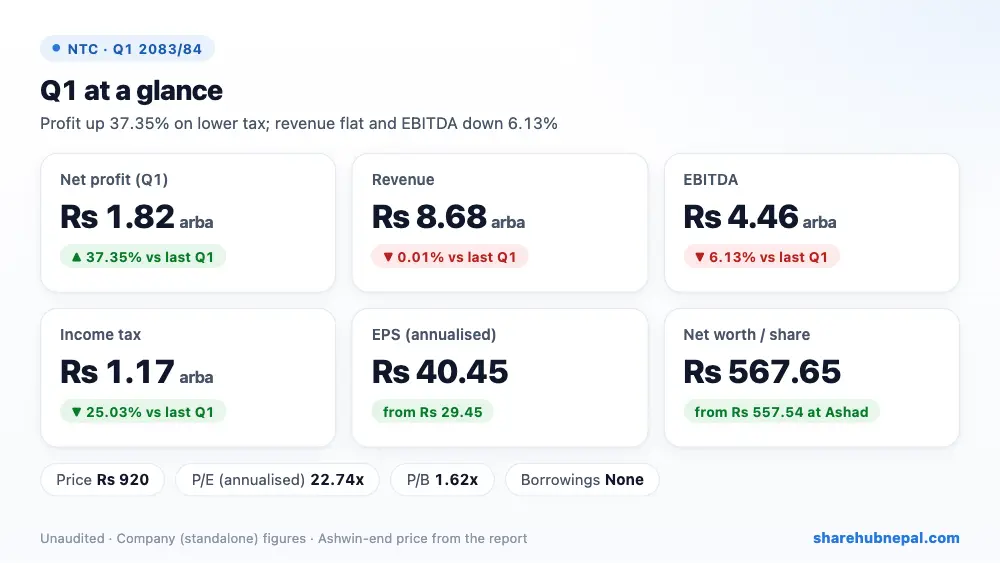
Nepal Telecom (company standalone) earned a net profit of Rs 1.82 arba in the first quarter of FY 2083/84, up 37.35% from Rs 1.33 arba a year ago. The jump did not come from the business: revenue was flat at Rs 8.68 arba and EBITDA fell 6.13% to Rs 4.46 arba as staff cost rose. Profit before tax rose only 3.65%; most of the gain came from a much lower tax charge (Rs 1.17 arba vs Rs 1.56 arba) and lower depreciation. Annualised EPS is Rs 40.45 and net worth per share is Rs 567.65. The company has no borrowings and holds about Rs 69.92 arba in cash and investments.
| Indicator | Q1 2083/84 | Q1 2082/83 | Change |
| Revenue from services | Rs 8,678,255,000 | Rs 8,679,515,000 | −0.01% |
| Network and regulatory costs | Rs 2,626,312,000 | Rs 2,527,048,000 | +3.93% |
| Staff, sales and office costs | Rs 2,558,334,000 | Rs 2,303,771,000 | +11.05% |
| Finance income, other income and FX gain | Rs 965,427,000 | Rs 901,774,000 | +7.06% |
| EBITDA | Rs 4,459,036,000 | Rs 4,750,471,000 | −6.13% |
| Depreciation and amortisation | Rs 1,497,566,000 | Rs 1,688,113,000 | −11.29% |
| Profit before tax | Rs 2,987,415,000 | Rs 2,882,116,000 | +3.65% |
| Income tax (current + deferred) | Rs 1,167,273,000 | Rs 1,556,941,000 | −25.03% |
| Net profit | Rs 1,820,141,000 | Rs 1,325,175,000 | +37.35% |
| EPS (annualised) | 40.45 | 29.45 | – |
| Net worth per share | 567.65 | 505.75 | – |
1. Where the profit came from
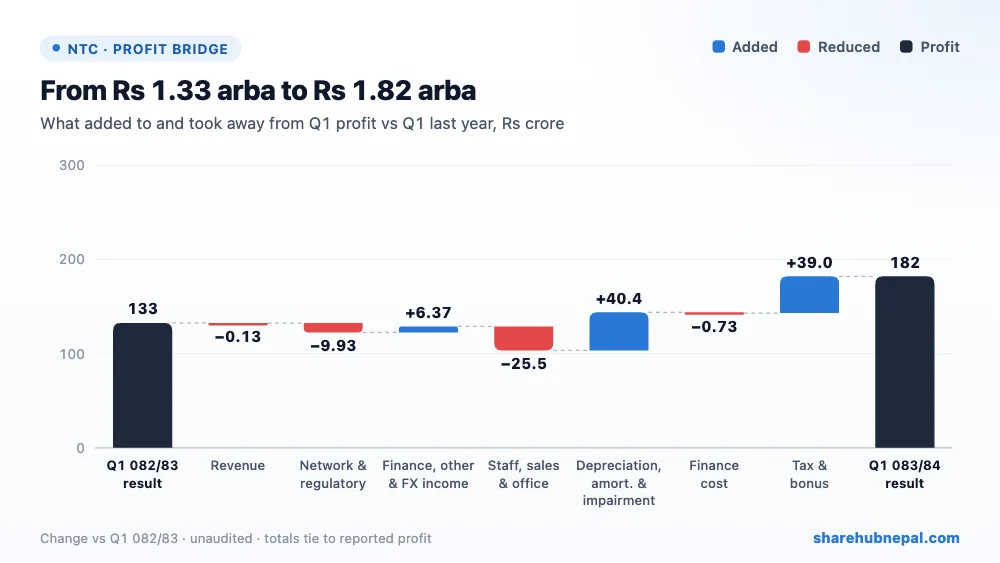
Revenue from services was Rs 8.68 arba, almost exactly the same as last year (down 0.01%). Staff cost rose 13.42% to Rs 2.11 arba, operation and maintenance cost rose 5.71% to Rs 1.61 arba and sales-channel cost rose 71.98% to Rs 14.71 crore, while office cost fell 16.10%. As a result EBITDA fell 6.13% to Rs 4.46 arba and the EBITDA margin slipped to 51.38% from 54.73%. Below EBITDA things improved: depreciation and amortisation fell 11.29% to Rs 1.50 arba, impairment turned into a write-back of Rs 6.72 crore (a Rs 14.63 crore charge last year), finance income rose 10.61% to Rs 68.68 crore and the foreign-exchange gain was Rs 16.60 crore. Profit before tax rose 3.65% to Rs 2.99 arba. The tax charge fell 25.03% to Rs 1.17 arba (39.07% of profit before tax, against an unusually high 54.02% last year), which is the main reason net profit rose 37.35%.
2. Profit through the year
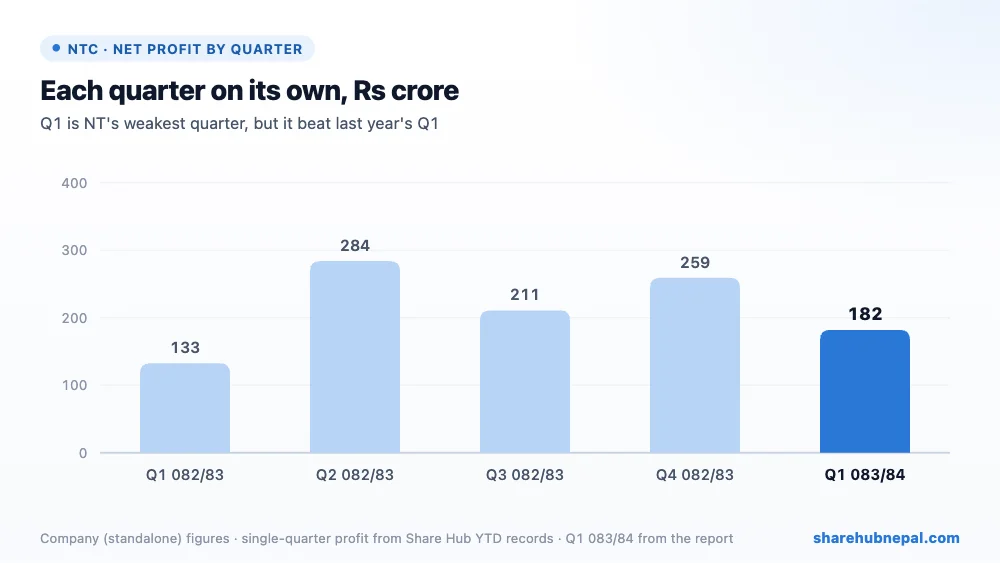
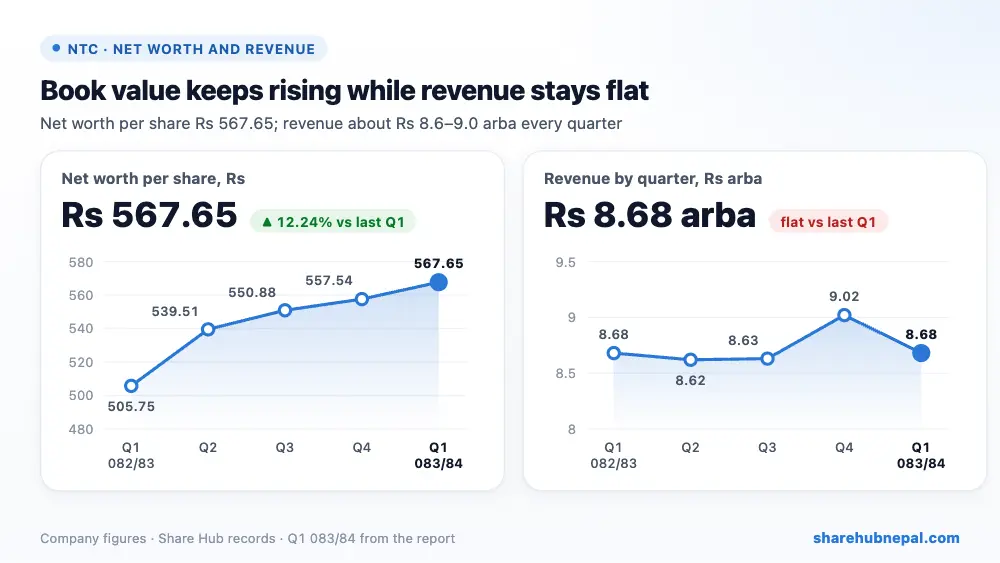
Profit by quarter (Share Hub records): Q1 082/83: Rs 1.33 arba, Q2 082/83: Rs 2.84 arba, Q3 082/83: Rs 2.11 arba, Q4 082/83: Rs 2.59 arba, Q1 083/84: Rs 1.82 arba. Q1 is usually NT's weakest quarter. Last year Q1 earned Rs 1.33 arba, then Q2 Rs 2.84 arba, Q3 Rs 2.11 arba and Q4 Rs 2.59 arba (FY Rs 8.86 arba). Revenue has stayed between Rs 8.62 and 9.02 arba a quarter for five quarters, so profit growth now depends on costs and tax rather than sales.
3. Balance sheet and cash
| Particulars | Ashwin 2083 | Ashad 2083 | Change |
| Total assets | Rs 138,631,808,000 | Rs 138,126,091,000 | +0.37% |
| Total equity | Rs 102,176,811,000 | Rs 100,356,484,000 | +1.81% |
| Cash and cash equivalents | Rs 22,184,068,000 | Rs 23,876,813,000 | −7.09% |
| Investments (current + non-current) | Rs 47,738,543,000 | Rs 43,763,144,000 | +9.08% |
| Post-employment benefit liability | Rs 11,850,420,000 | Rs 13,820,723,000 | −14.26% |
| Total current liabilities | Rs 21,061,548,000 | Rs 20,266,850,000 | +3.92% |
The balance sheet is very strong. Equity rose to Rs 102.18 arba (by the Q1 profit) and the company has no bank loans. Cash fell by Rs 16.93 crore to Rs 22.18 arba, but current investments rose by Rs 3.50 arba to Rs 27.72 arba; with non-current investments of Rs 20.02 arba, cash and investments total about Rs 69.92 arba, around half of total assets. The post-employment benefit liability fell by Rs 1.97 arba to Rs 11.85 arba, even though the actuarial discount rate was cut from 7% to 6.5%; the report does not explain the fall. Current assets cover current liabilities 2.65 times. Capital work-in-progress fell to Rs 2.06 arba as projects were capitalised, and property, plant and equipment fell to Rs 43.33 arba as depreciation ran ahead of new investment.
4. Per-share figures and valuation
| Indicator | Value |
| EPS (annualised) | Rs 40.45 |
| Net worth per share | Rs 567.65 |
| Market price (Ashwin end) | Rs 920 |
| P/E (annualised) | 22.74x |
| P/B | 1.62x |
At the Ashwin-end price of Rs 920, the share trades at 22.74 times annualised EPS and 1.62 times net worth per share. The report prints P/E 22.75. NT's Q1 has been its weakest quarter, so a full-year EPS above Rs 40.45 is possible if the later quarters follow last year's pattern; last year's full-year EPS was Rs 49.25. P/B of 1.62 is low for a debt-free company, reflecting flat revenue.
Conclusion
Positives: net profit up 37.35%, no debt, about Rs 69.92 arba in cash and investments, lower depreciation, a small impairment write-back and higher finance income.
Watch: revenue has not grown for five quarters, EBITDA fell 6.13% as staff cost rose 13.42%, most of the profit growth came from a lower tax charge, and voice revenue keeps losing to OTT apps and private competition.
Watch whether NT can grow revenue through FTTH, 4G data and enterprise services, keep staff cost in check, and whether the lower tax rate holds in the coming quarters.
Figures are from the company's unaudited Q1 report; quarter trends use Share Hub records. This is not investment advice.

