













Pure Energy Limited – First Quarter Analysis, FY 2083/84
Unaudited results as on Ashwin end 2083, compared with the same quarter last year (Ashwin end 2082) and with Ashad end 2083.
Summary
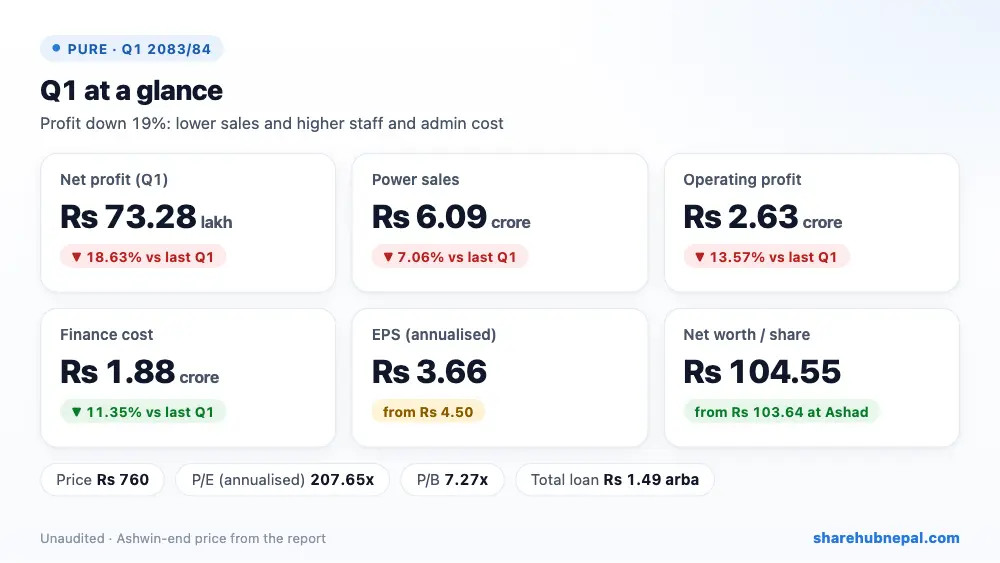
Pure Energy earned Rs 73.28 lakh in the first quarter of FY 2083/84, down 18.63% from Rs 90.05 lakh a year ago. Power sales fell 7.06% to Rs 6.09 crore, and plant, staff and admin costs rose. Lower depreciation and interest cost softened the fall. Annualised EPS is Rs 3.66 against Rs 4.50, and net worth per share is Rs 104.55.
| Indicator | Q1 2083/84 | Q1 2082/83 | Change |
| Revenue from sales | Rs 60,891,683 | Rs 65,515,186 | −7.06% |
| Cost of sales | Rs 4,218,108 | Rs 3,701,281 | +13.96% |
| Other income | Rs 28,935 | Rs 39,923 | −27.52% |
| Operating profit | Rs 26,318,439 | Rs 30,450,167 | −13.57% |
| Finance cost | Rs 18,770,865 | Rs 21,174,521 | −11.35% |
| Income tax | Rs 0 | Rs 0 | – |
| Net profit | Rs 7,327,742 | Rs 9,005,481 | −18.63% |
| EPS (annualised) | 3.66 | 4.5 | – |
| Net worth per share | 104.55 | 101.61 | – |
1. Where the profit came from
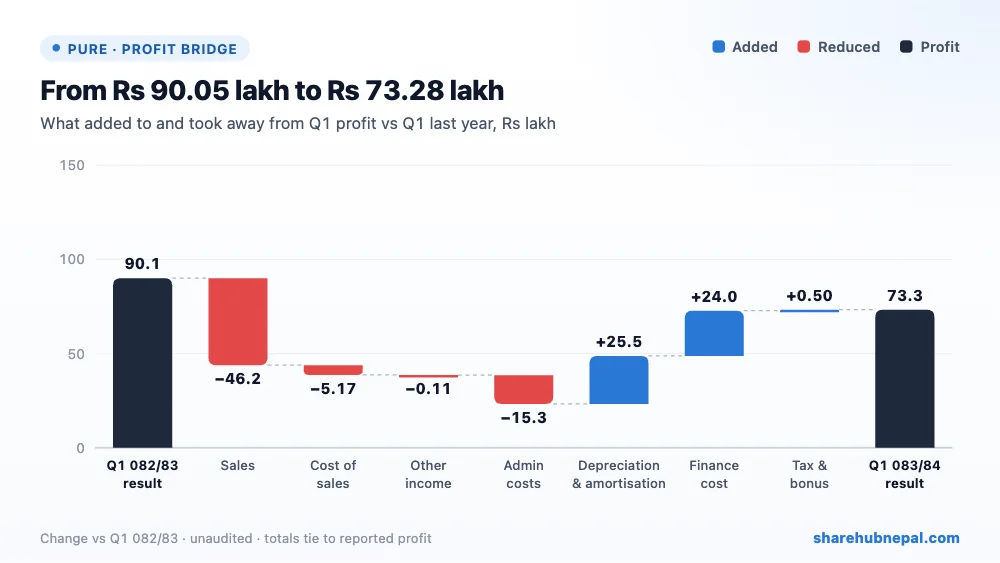
Lower power sales took away Rs 46.24 lakh. Staff and admin cost rose Rs 15.27 lakh and plant cost Rs 5.17 lakh. Depreciation fell Rs 25.47 lakh and interest Rs 24.04 lakh, which recovered most of the gap. There is no income tax yet.
2. Profit through the year
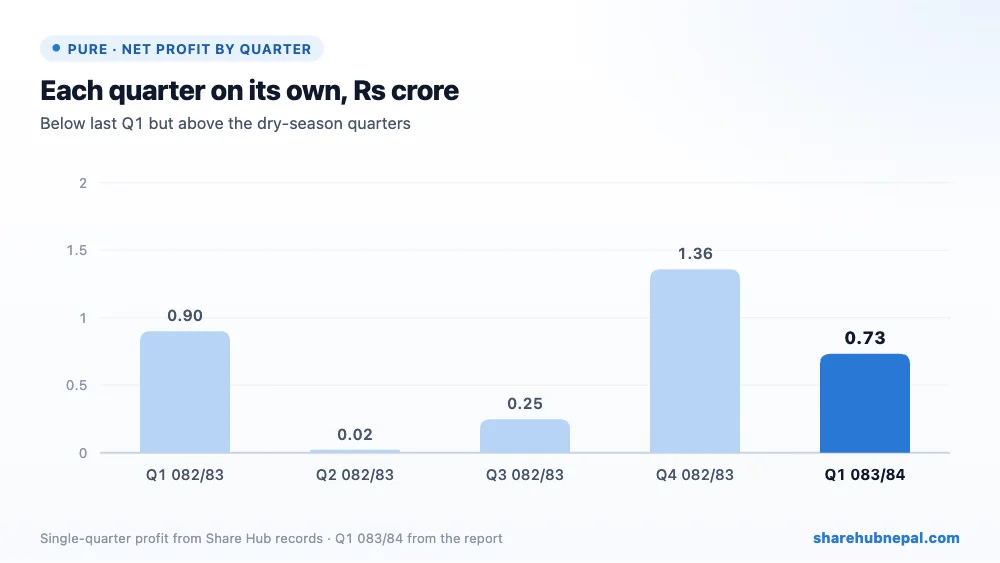
Profit by quarter (Share Hub records): Q1 082/83: Rs 90.05 lakh, Q2 082/83: Rs 2.23 lakh, Q3 082/83: Rs 24.84 lakh, Q4 082/83: Rs 1.36 crore, Q1 083/84: Rs 73.28 lakh. Last year profit was steady in Q1 and Q4 but close to zero in Q2. FY 2082/83 EPS was Rs 3.16.
3. Debt and balance sheet
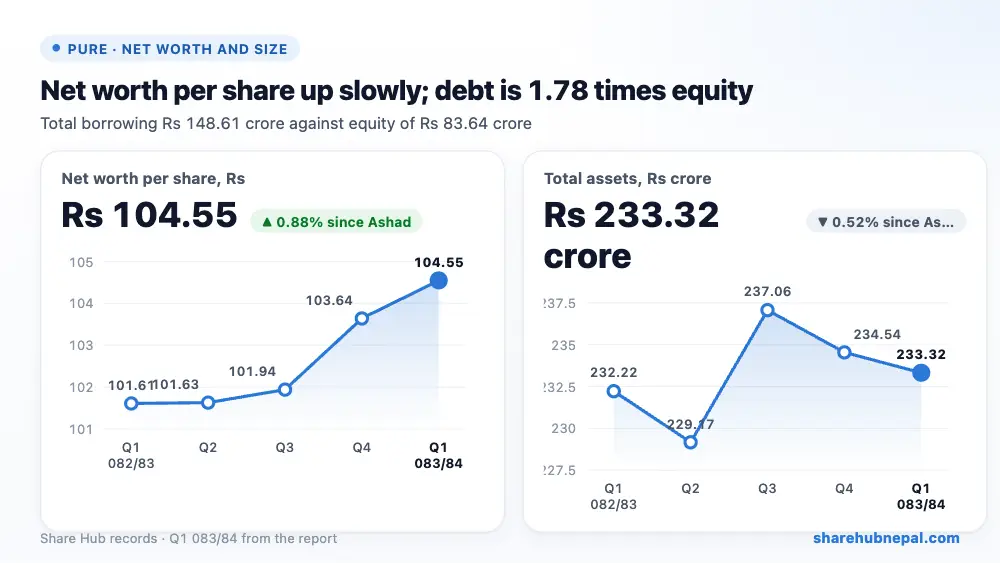
| Particulars | Ashwin 2083 | Ashad 2083 | Change |
| Total assets | Rs 2,333,228,169 | Rs 2,345,425,502 | −0.52% |
| Total equity | Rs 836,438,266 | Rs 829,110,524 | +0.88% |
| Long-term borrowings | Rs 1,383,954,303 | Rs 1,405,494,176 | −1.53% |
| Current borrowings | Rs 102,140,616 | Rs 102,462,984 | −0.31% |
| Cash and equivalents | Rs 11,229,231 | Rs 3,327,550 | +237.46% |
Total assets are Rs 2.33 arba, mostly the plant (Rs 1.98 arba). Investments rose to Rs 16.40 crore from Rs 4.20 crore a year ago (Rs 15.70 crore at Ashad end). Long-term loan fell to Rs 1.38 arba from Rs 1.41 arba; short-term loan is Rs 10.21 crore. Cash is only Rs 1.12 crore and the current ratio is 0.52.
4. Per-share figures and valuation
| Indicator | Value |
| EPS (annualised) | Rs 3.66 |
| Net worth per share | Rs 104.55 |
| Market price (Ashwin end) | Rs 760 |
| P/E (annualised) | 207.65x |
| P/B | 7.27x |
At the Ashwin-end price of Rs 760, the share trades at 207.65 times annualised EPS and 7.27 times net worth per share. This is a very high price for current earnings; the share trades far above its book value.
Conclusion
Positives: loan being repaid, lower interest and depreciation, net worth per share up to Rs 104.55, investments built up.
Watch: sales down 7% in the peak season, staff and admin cost up 33%, low cash and current ratio 0.52, debt 1.78 times equity, and a P/E above 200.
A weaker quarter than last year with thin profit on a large debt-funded plant. The price assumes much better earnings than the report shows.
Figures are from the company's unaudited Q1 report; quarter trends use Share Hub records. This is not investment advice.

