













Radhi Bidyut Company Limited – First Quarter Analysis, FY 2083/84
Unaudited results as on Ashwin end 2083, compared with the same quarter last year (Ashwin end 2082) and with Ashad end 2083.
Summary
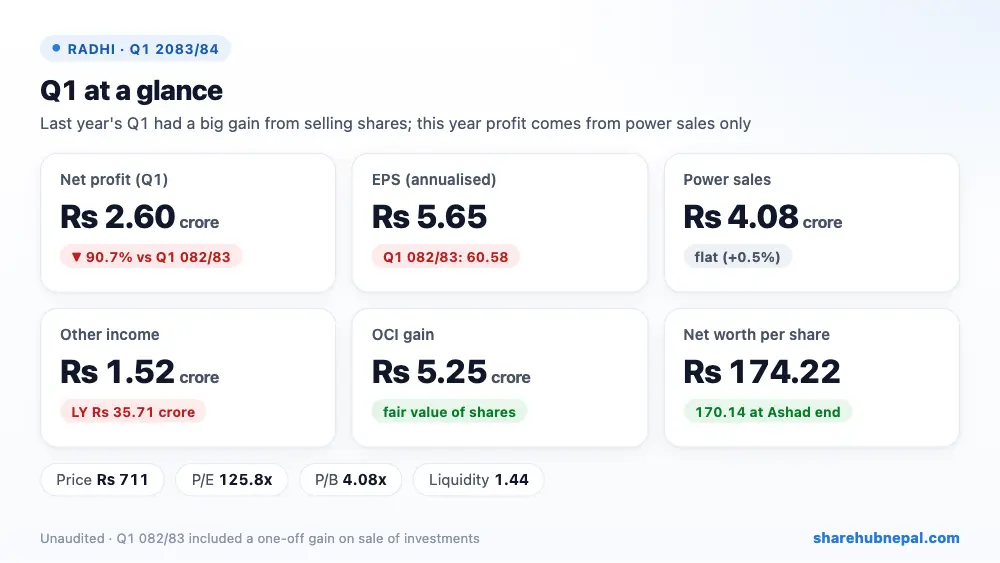
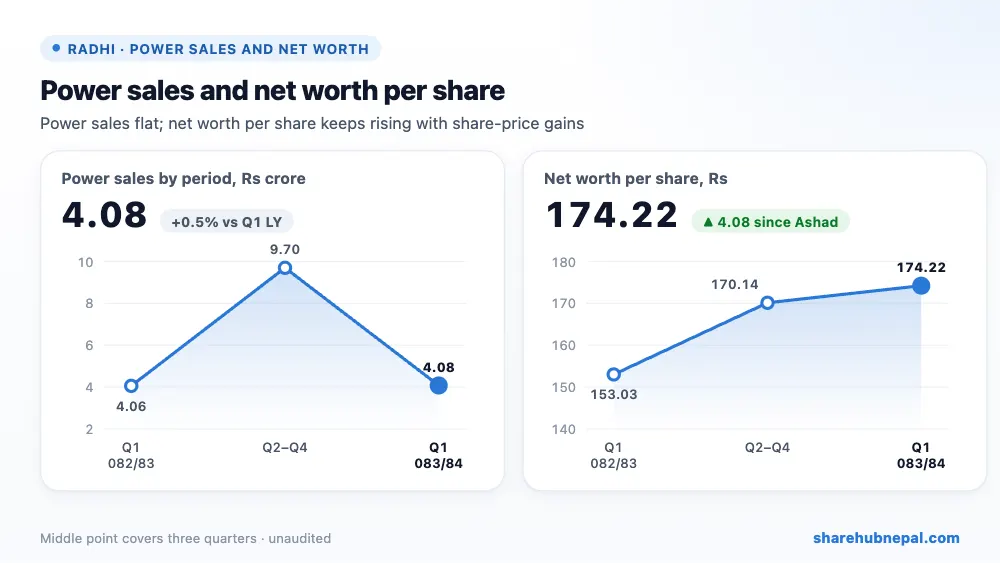
Radhi Bidyut earned a net profit of Rs 2.60 crore in the first quarter of 2083/84, down 90.67% from Rs 27.85 crore a year ago. Annualised EPS fell to Rs 5.65 from 60.58. Net worth per share rose to Rs 174.22.
The fall looks large but is mostly a one-off: last year's Q1 included a big gain from selling part of the company's investments (other income was Rs 35.71 crore). The company says this year's Q1 income came only from power sales and regular business. Power sales were flat at Rs 4.08 crore; NEA's 33 kV line outages kept hurting generation. The company's shares in other companies also rose in value, adding Rs 5.25 crore to equity through other comprehensive income.
| Indicator | Q1 2083/84 | Q1 2082/83 | Change |
| Revenue (power sales) | Rs 40,835,222 | Rs 40,630,438 | +0.50% |
| Generation expenses | Rs 5,055,491 | Rs 7,990,736 | −36.73% |
| Other income | Rs 15,205,245 | Rs 357,059,571 | −95.74% |
| Administrative and other expenses | Rs 8,207,110 | Rs 13,502,674 | −39.22% |
| Profit from operation | Rs 37,041,077 | Rs 370,340,999 | −90.00% |
| Finance costs | Rs 4,858,720 | Rs 7,666,638 | −36.63% |
| Income tax | Rs 8,165,518 | Rs 86,644,112 | −90.58% |
| Net profit | Rs 25,978,340 | Rs 278,513,405 | −90.67% |
| Other comprehensive income | Rs 52,480,946 | Rs 75,039,778 | −30.06% |
1. Where the profit came from
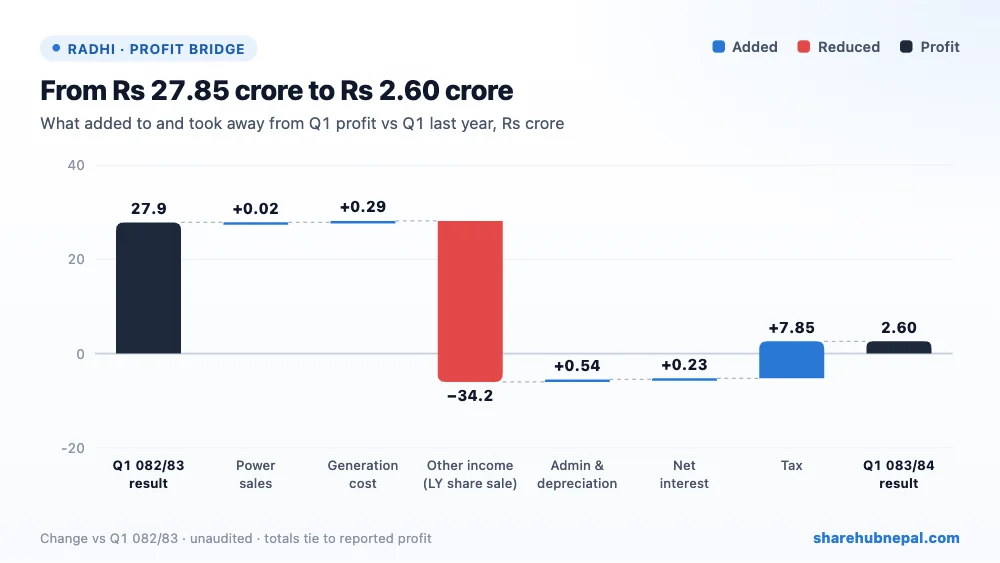
Against Q1 last year, lower other income (the one-off share-sale gain) took away Rs 34.19 crore. Much lower tax gave back Rs 7.85 crore, lower admin and depreciation Rs 54.14 lakh, lower generation cost Rs 29.35 lakh and lower net interest Rs 22.86 lakh. Power sales hardly changed. Net: profit down Rs 25.25 crore.
2. Profit through the year
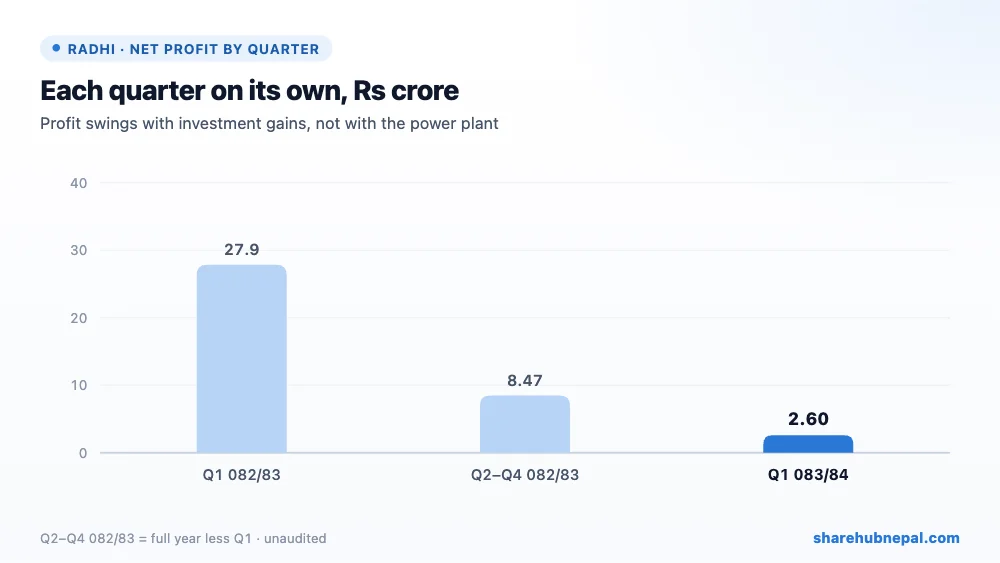
RADHI's profit is driven by its investments more than by its own small plant. In 2082/83 it earned Rs 27.85 crore in Q1 (mostly the share-sale gain) and Rs 8.47 crore in the other three quarters together, for a full-year profit of Rs 36.33 crore (EPS 19.75). Without a similar gain, this year's EPS will be much lower unless the company sells more investments.
3. Debt and balance sheet
| Particulars | Ashwin 2083 | Ashad 2083 | Change |
| Property, plant and equipment | Rs 430,833,820 | Rs 436,222,226 | −1.24% |
| Investments (subsidiary, associates, other shares) | Rs 2,581,141,635 | Rs 2,511,167,040 | +2.79% |
| Other non-current assets | Rs 488,897,467 | Rs 381,311,611 | +28.21% |
| Trade receivables (NEA) | Rs 86,828,752 | Rs 80,391,833 | +8.01% |
| Long-term borrowings | Rs 237,250,000 | Rs 252,250,000 | −5.95% |
| Short-term borrowings | Rs 166,300,025 | Rs 71,000,328 | +134.22% |
| Total equity | Rs 3,203,808,205 | Rs 3,128,912,265 | +2.39% |
Most of RADHI's assets are investments: Rs 2.58 arba in subsidiary, associates and other listed shares, plus Rs 48.89 crore of other non-current assets. Its investee projects are generating and selling power to NEA, and the subsidiary Kasuwa Khola Hydropower is building the Kasuwa Khola project. Short-term borrowing more than doubled to Rs 16.63 crore (from Rs 7.10 crore) while long-term loans fell to Rs 23.73 crore. A 1:0.6989 right share, approved by the Electricity Regulatory Commission, has been filed at SEBON to repay long-term loans and invest in the subsidiary.
4. Per-share figures and valuation
| Indicator | Value |
| EPS (annualised, report) | Rs 5.65 |
| EPS (quarter, derived) | Rs 1.41 |
| Net worth per share | Rs 174.22 |
| Total assets per share | Rs 205.16 |
| Market price (Q1 close) | Rs 711 |
| P/E (report) | 125.83x |
| P/B | 4.08x |
| Liquidity ratio | 1.44 |
The Q1 closing price was Rs 711 (range Rs 667 to Rs 779). On the annualised Q1 EPS the P/E is about 126 times; even on last year's EPS of 19.75 it is 36.0 times. The price is 4.08 times net worth per share. The market is valuing RADHI mainly on its investment portfolio and the coming right share, not on its plant's earnings.
Conclusion
Positives: steady power sales, lower generation and admin costs, a rising value of its share investments (OCI gain), net worth per share at a new high, and an approved right share.
Watch: profit depending on one-off investment gains, a very high P/E, short-term loans that more than doubled, NEA line outages, and dilution from the right share.
RADHI's Q1 drop is mainly because last year had a one-off gain. Its core power business is steady but small; the value of the company lies in its investments and new projects, so watch those more than the quarterly EPS.
Figures are from the company's unaudited Q1 report; quarter trends use Share Hub records. This is not investment advice.

