













Reliable Nepal Life Insurance Limited – First Quarter Analysis, FY 2083/84
Unaudited results as on Ashwin end 2083, compared with the same quarter last year (Ashwin end 2082) and with Ashad end 2083.
Summary
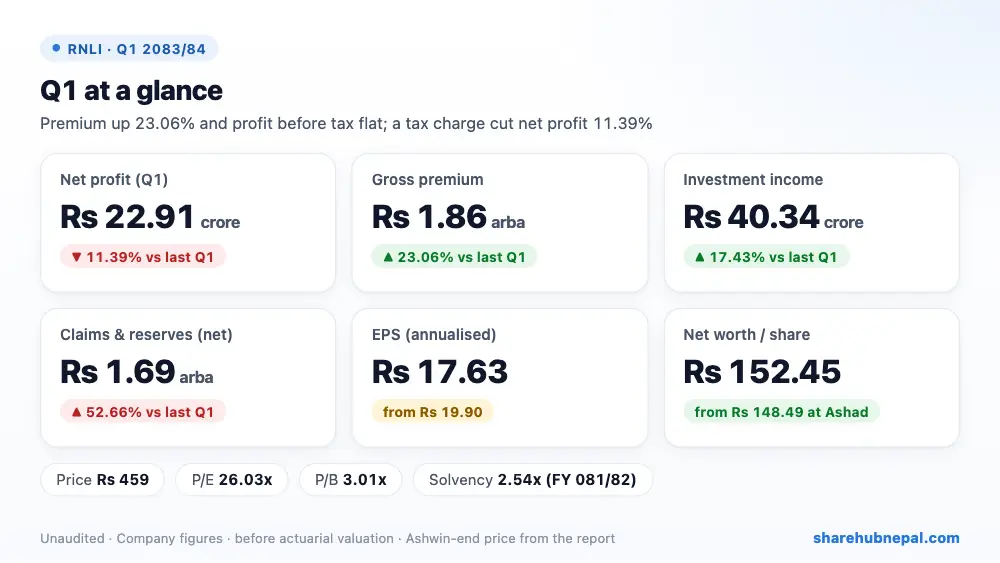
Reliable Nepal Life earned a net profit of Rs 22.91 crore in the first quarter of FY 2083/84 (company figures), down 11.39% from Rs 25.85 crore a year ago. Business grew well: gross earned premium rose 23.06% to Rs 1.86 arba, with first-year premium up 45.59%. Profit before tax was flat at Rs 24.50 crore, because claims and the addition to policy reserves rose 52.66% and costs also rose, while investment income rose 17.43% and an unrealised fair value gain of Rs 12.12 crore replaced last year's Rs 11.75 crore loss. The fall in net profit comes from tax: Rs 1.59 crore expense this year against a Rs 1.37 crore credit last year. Annualised EPS is Rs 17.63 and net worth per share Rs 152.45. These figures are before the actuarial valuation.
| Indicator | Q1 2083/84 | Q1 2082/83 | Change |
| Gross earned premium | Rs 1,862,712,253 | Rs 1,513,719,634 | +23.06% |
| Net earned premium | Rs 1,770,427,710 | Rs 1,429,444,213 | +23.85% |
| Income from investments and loans | Rs 403,412,385 | Rs 343,527,434 | +17.43% |
| Fair value gain/(loss) | Rs 121,161,593 | −Rs 117,484,070 | Turned to profit |
| Net benefits, claims and reserve change | Rs 1,692,345,302 | Rs 1,108,541,409 | +52.66% |
| Commission expenses | Rs 165,820,738 | Rs 137,194,101 | +20.87% |
| Other operating expenses | Rs 91,800,540 | Rs 62,522,205 | +46.83% |
| Profit before tax | Rs 244,958,666 | Rs 244,796,903 | +0.07% |
| Income tax (credit) | Rs 15,888,794 | −Rs 13,705,265 | Turned to profit |
| Net profit | Rs 229,069,873 | Rs 258,502,168 | −11.39% |
| EPS (annualised) | 17.63 | 19.9 | – |
| Net worth per share | 152.45 | 154.29 | – |
1. Where the profit came from
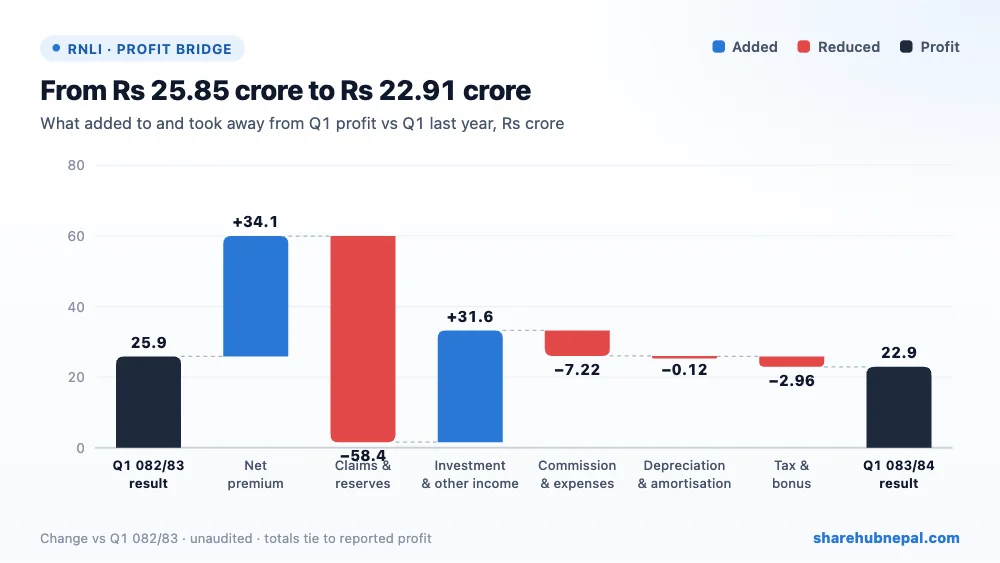
Net premium added Rs 34.10 crore, but claims and the reserve build-up took Rs 58.38 crore more: claims paid rose 39.31% to Rs 45.59 crore and the addition to policy liabilities rose 60.01% to Rs 1.31 arba. Commission, staff and other costs took Rs 7.22 crore more, with other operating expenses up 46.83%. Investment and other income added Rs 31.64 crore, mostly from the Rs 23.86 crore swing in fair value (a paper gain this year, a paper loss last year) and Rs 5.99 crore more investment income. So profit before tax was almost the same at Rs 24.50 crore, and the change in tax (Rs 2.96 crore) took net profit down to Rs 22.91 crore. Other comprehensive income was a loss of Rs 2.72 crore, so total comprehensive income was Rs 20.19 crore.
2. Profit through the year
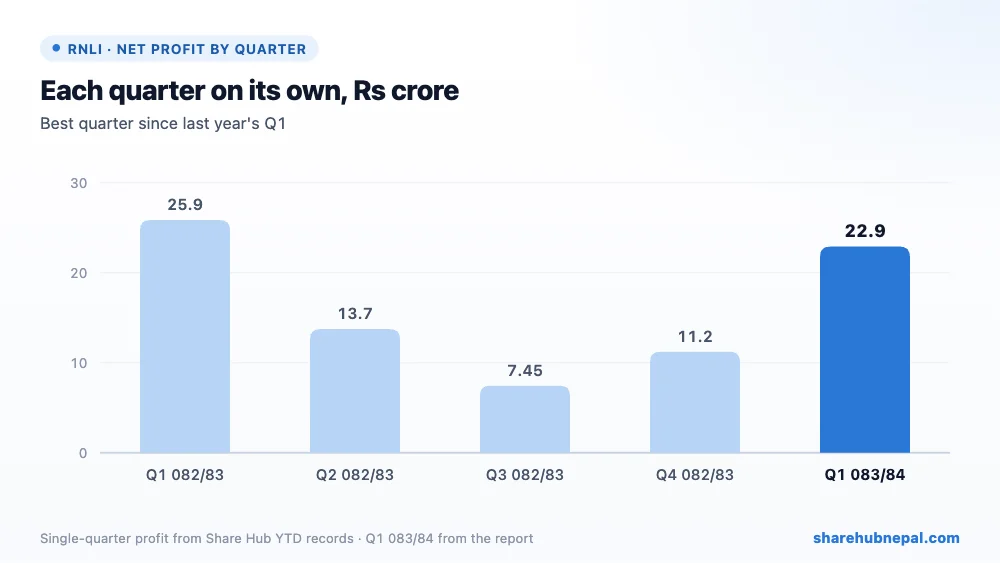
Profit by quarter (Share Hub records): Q1 082/83: Rs 25.85 crore, Q2 082/83: Rs 13.74 crore, Q3 082/83: Rs 7.45 crore, Q4 082/83: Rs 11.22 crore, Q1 083/84: Rs 22.91 crore. Last year Q1 was also the best quarter (Rs 25.85 crore); profit then fell to Rs 7.45 crore in Q3, and FY 2082/83 ended with Rs 58.26 crore (EPS Rs 11.21). So the annualised EPS of Rs 17.63 may not hold for the full year, and part of this quarter's profit is an unrealised fair value gain that can reverse if share prices fall.
3. Debt and balance sheet
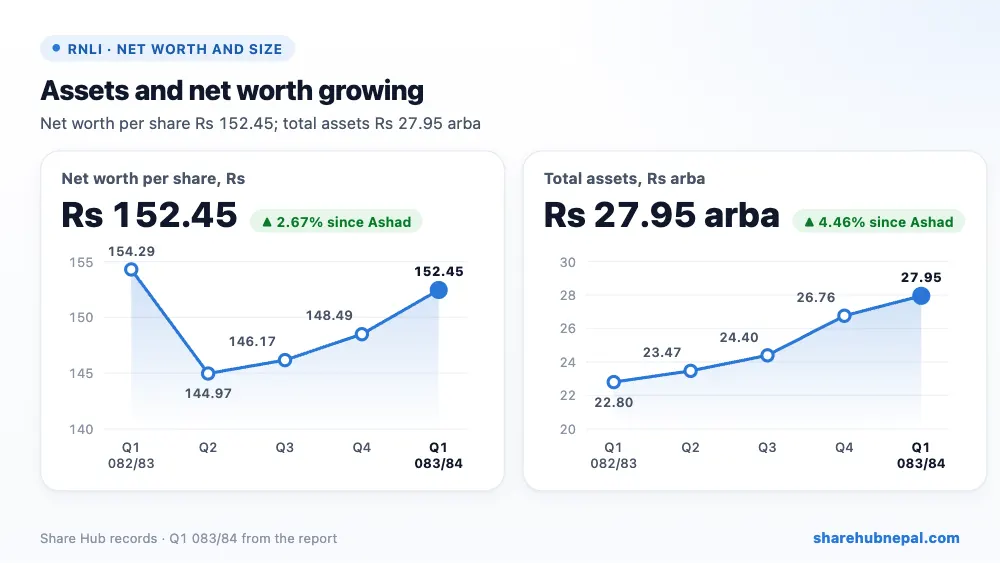
| Particulars | Ashwin 2083 | Ashad 2083 | Change |
| Total assets | Rs 27,949,444,843 | Rs 26,755,295,923 | +4.46% |
| Investments | Rs 24,480,900,956 | Rs 24,074,889,725 | +1.69% |
| Loans (mostly to policyholders) | Rs 752,689,121 | Rs 711,117,321 | +5.85% |
| Gross insurance contract liabilities | Rs 19,494,506,744 | Rs 17,939,475,211 | +8.67% |
| Total equity | Rs 7,922,371,888 | Rs 7,716,660,617 | +2.67% |
| Cash and equivalents | Rs 857,549,462 | Rs 313,864,323 | +173.22% |
Total assets rose 4.46% since Ashad to Rs 27.95 arba. Investments are Rs 24.48 arba, and cash rose to Rs 85.75 crore from Rs 31.39 crore while other financial liabilities fell to Rs 26.99 crore from Rs 96.35 crore. Insurance contract liabilities rose 8.67% to Rs 19.49 arba. Equity rose by Rs 20.57 crore to Rs 7.92 arba (Rs 152.45 per share), in line with the quarter's total comprehensive income. There are no borrowings, and the last approved solvency ratio is 2.54 (FY 2081/82).
4. Per-share figures and valuation
| Indicator | Value |
| EPS (annualised) | Rs 17.63 |
| Net worth per share | Rs 152.45 |
| Market price (Ashwin end) | Rs 459 |
| P/E (annualised) | 26.04x |
| P/B | 3.01x |
At the Ashwin-end price of Rs 459, the share trades at 26.04 times annualised EPS and 3.01 times net worth per share. Q1 was the strongest quarter last year too; on last year's full EPS of Rs 11.21 the P/E is about 40.95 times.
Conclusion
Positives: gross premium up 23.06%, first-year premium up 45.59% and renewal premium up 18.43%, new policies up 20.69%, investment income up 17.43%, much more cash, no borrowings, and a solvency ratio of 2.54.
Watch: net profit down 11.39%, claims and reserves up 52.66%, other operating expenses up 46.83%, policies in force down 10.20% (705,002 to 633,116), outstanding claims up to 447 (Rs 8.50 crore), part of the profit is an unrealised fair value gain, and the figures are before the actuarial valuation.
Sales of new policies are strong, but claims, reserves and costs grew faster, and tax returned. Watch investment income, the share-market effect on fair value, the fall in policies in force and the year-end actuarial valuation.
Figures are from the company's unaudited Q1 report; quarter trends use Share Hub records. This is not investment advice.

