













Singati Hydro Energy Ltd – First Quarter Analysis, FY 2083/84
Unaudited results as on Ashwin end 2083, compared with the same quarter last year (Ashwin end 2082) and with Ashad end 2083.
Summary
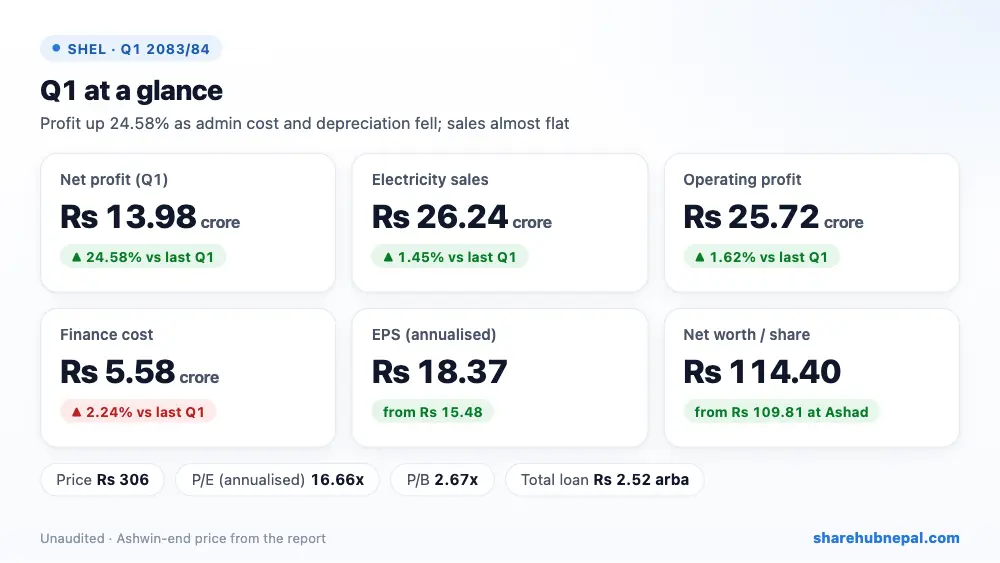
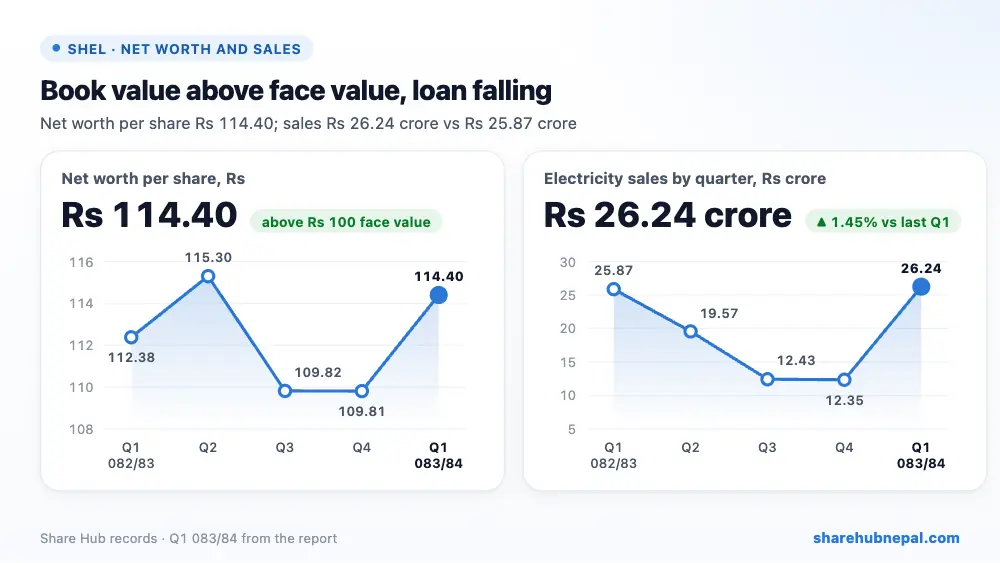
Singati Hydro Energy earned a net profit of Rs 13.98 crore in the first quarter of FY 2083/84, up 24.58% from Rs 11.22 crore a year ago. Electricity sales grew only 1.45% to Rs 26.24 crore; most of the gain came from lower costs, as administrative expenses fell 46.31% and depreciation fell 18.36%. Interest cost was almost flat at Rs 5.58 crore. Annualised EPS is Rs 18.37 and net worth per share is Rs 114.40. No income tax was charged, and the company reports no adverse incident or legal case in the quarter.
| Indicator | Q1 2083/84 | Q1 2082/83 | Change |
| Revenue from sales | Rs 262,431,129 | Rs 258,675,831 | +1.45% |
| Cost of sales | Rs 5,248,623 | Rs 5,587,763 | −6.07% |
| Other income | Rs 42,292 | Rs 32,505 | +30.11% |
| Operating profit | Rs 257,182,507 | Rs 253,088,068 | +1.62% |
| Finance cost | Rs 55,828,697 | Rs 54,605,139 | +2.24% |
| Income tax | Rs 0 | Rs 0 | – |
| Net profit | Rs 139,812,974 | Rs 112,228,069 | +24.58% |
| EPS (annualised) | 18.37 | 15.48 | – |
| Net worth per share | 114.4 | 112.38 | – |
1. Where the profit came from
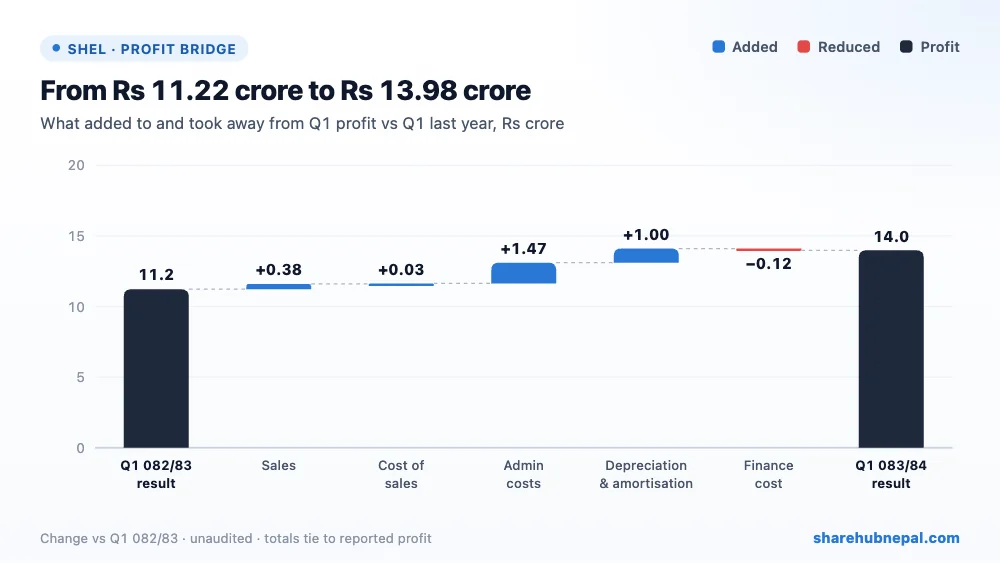
Sales added Rs 37.55 lakh and cost of sales fell by Rs 3.39 lakh, so operating income (sales less cost of sales) rose 1.62% to Rs 25.72 crore. The bigger change was in expenses: administrative and general expenses fell by Rs 1.47 crore to Rs 1.70 crore, and depreciation fell by Rs 1.00 crore to Rs 4.46 crore. The report does not explain either fall. Interest expense rose 2.24% to Rs 5.58 crore even though the long-term loan came down. Other income is tiny (Rs 42,292) and there is no tax, so the whole gain of Rs 2.76 crore reached net profit.
2. Profit through the year
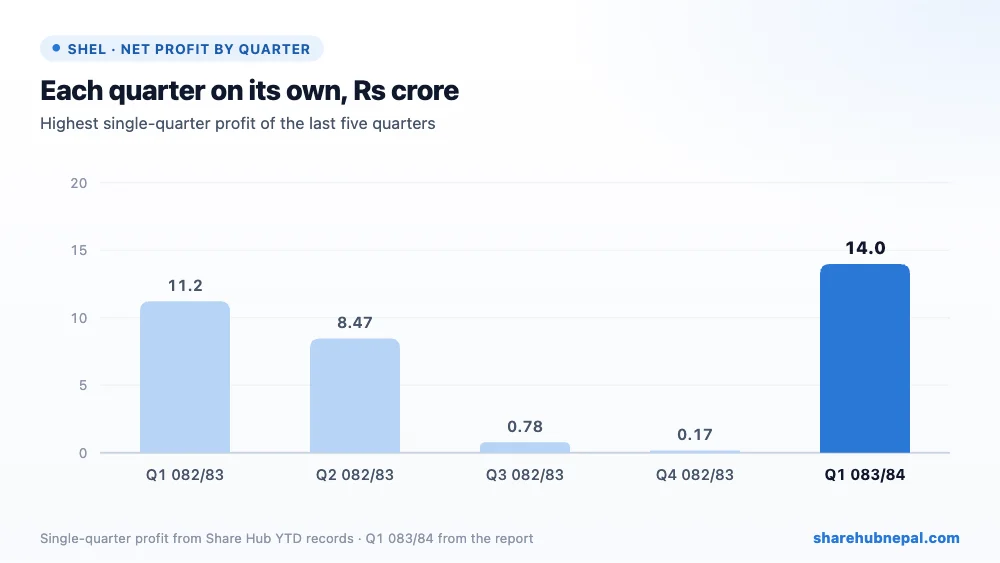
Profit by quarter (Share Hub records): Q1 082/83: Rs 11.22 crore, Q2 082/83: Rs 8.47 crore, Q3 082/83: Rs 77.88 lakh, Q4 082/83: Rs 17.49 lakh, Q1 083/84: Rs 13.98 crore. FY 2082/83 earned Rs 20.65 crore in total, and Q1 alone gave Rs 11.22 crore of it; the dry-season quarters Q3 and Q4 earned only Rs 77.88 lakh and Rs 17.49 lakh. So this quarter's Rs 13.98 crore is a monsoon peak, and the rest of the year is likely to be much weaker, as it was last year.
3. Debt and balance sheet
| Particulars | Ashwin 2083 | Ashad 2083 | Change |
| Total assets | Rs 6,480,939,923 | Rs 6,405,186,632 | +1.18% |
| Total equity | Rs 3,483,556,223 | Rs 3,343,743,249 | +4.18% |
| Long-term borrowings | Rs 2,518,190,650 | Rs 2,566,010,710 | −1.86% |
| Cash and equivalents | Rs 118,784,590 | Rs 95,216,339 | +24.75% |
The long-term loan fell by Rs 4.78 crore in the quarter to Rs 2.52 arba (Rs 2.70 arba a year ago) and is now 0.72 times equity. Equity rose to Rs 3.48 arba, exactly by the Q1 profit. Cash rose to Rs 11.88 crore from Rs 9.52 crore, but other current assets (mostly money still to be collected; the report gives no breakdown) jumped by Rs 9.21 crore to Rs 25.03 crore. Creditors and payables are Rs 47.56 crore, so current assets cover only 0.78 times current liabilities. Investments of Rs 98.56 crore are unchanged since Ashad end.
4. Per-share figures and valuation
| Indicator | Value |
| EPS (annualised) | Rs 18.37 |
| Net worth per share | Rs 114.40 |
| Market price (Ashwin end) | Rs 306 |
| P/E (annualised) | 16.66x |
| P/B | 2.67x |
At the Ashwin-end price of Rs 306, the share trades at 16.66 times annualised EPS and 2.67 times net worth per share. But Q1 is the strongest season: FY 2082/83 EPS was only Rs 6.78, which is a P/E of 45.13 at today's price, so the annualised P/E makes the share look cheaper than a full year is likely to justify.
Conclusion
Positives: profit up 24.58%, admin cost almost halved, the long-term loan coming down, more cash, no tax and no legal cases, and net worth per share of Rs 114.40, above face value.
Watch: sales grew only 1.45%, the falls in admin cost and depreciation are not explained, other current assets jumped by Rs 9.21 crore, the current ratio is 0.78, and last year the dry-season quarters were close to break-even.
Watch whether the lower admin cost continues in Q2, whether the money in other current assets is collected, and how much the dry-season quarters earn this year compared with last year's Rs 77.88 lakh and Rs 17.49 lakh.
Figures are from the company's unaudited Q1 report; quarter trends use Share Hub records. This is not investment advice.

