













Shivam Cements Ltd. – First Quarter Analysis, FY 2083/84
Unaudited results as on Ashwin end 2083, compared with the same quarter last year (Ashwin end 2082).
Summary
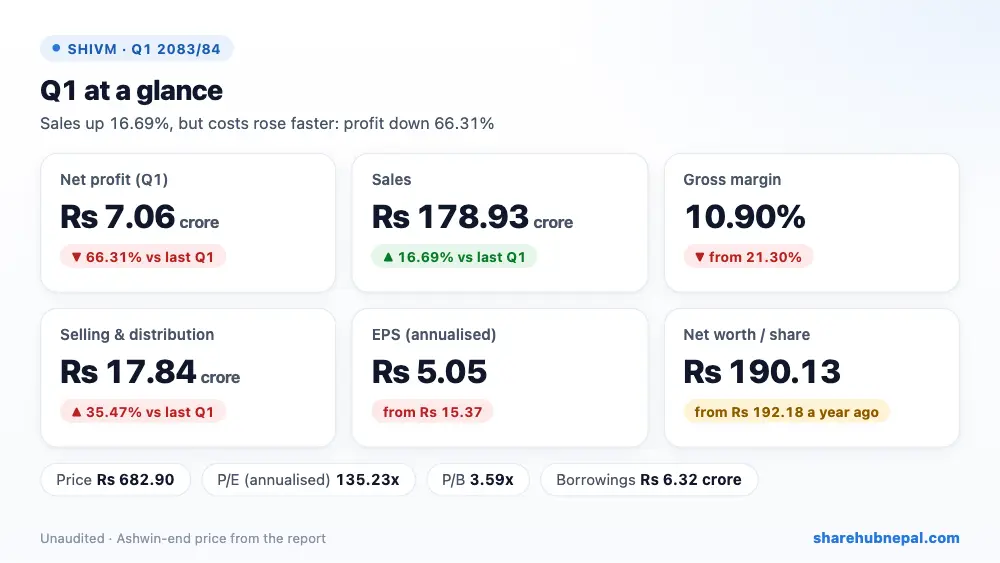
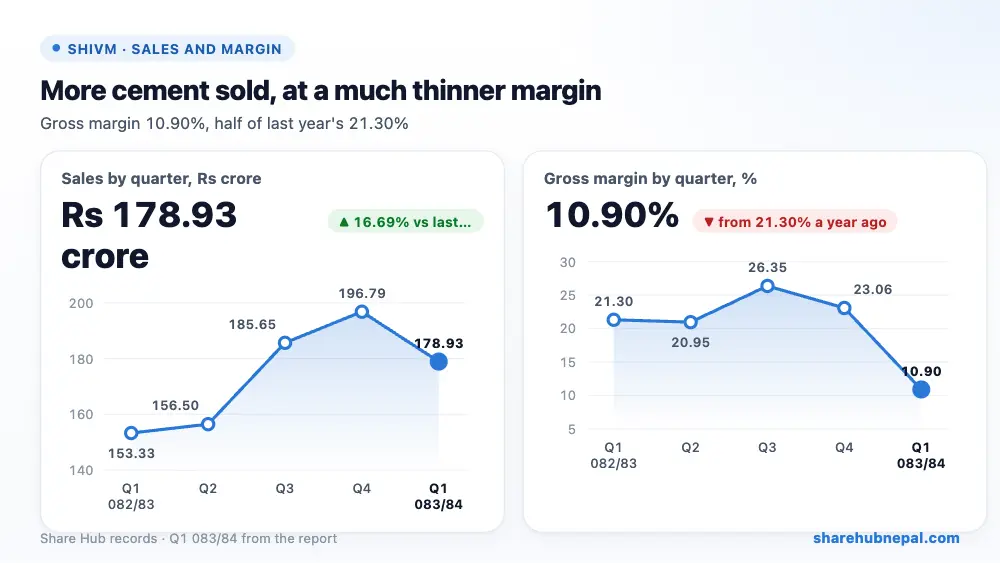
Shivam Cements earned Rs 7.06 crore in the first quarter of FY 2083/84, down 66.31% from Rs 20.97 crore a year ago. Sales rose 16.69% to Rs 178.93 crore, but cost of sales rose 32.10%, so gross profit fell 40.25% to Rs 19.51 crore and the gross margin halved from 21.30% to 10.90%. Selling and distribution cost also rose 35.47%. Annualised EPS fell to Rs 5.05 from Rs 15.37, and net worth per share is Rs 190.13.
| Indicator | Q1 2083/84 | Q1 2082/83 | Change |
| Revenue from operations | Rs 1,789,262,756 | Rs 1,533,309,617 | +16.69% |
| Cost of sales | Rs 1,594,147,539 | Rs 1,206,737,196 | +32.10% |
| Gross profit | Rs 195,115,217 | Rs 326,572,421 | −40.25% |
| Other income | Rs 105,545,943 | Rs 103,656,894 | +1.82% |
| Administration expenses | Rs 45,597,247 | Rs 61,879,452 | −26.31% |
| Selling and distribution expenses | Rs 178,422,770 | Rs 131,702,941 | +35.47% |
| Finance cost | Rs 289,677 | Rs 3,212,745 | −90.98% |
| Income tax (current + deferred) | Rs 5,721,386 | Rs 23,765,308 | −75.93% |
| Net profit | Rs 70,630,080 | Rs 209,668,868 | −66.31% |
| EPS (annualised) | 5.05 | 15.37 | – |
| Net worth per share | 190.13 | 192.18 | – |
1. Where the profit came from
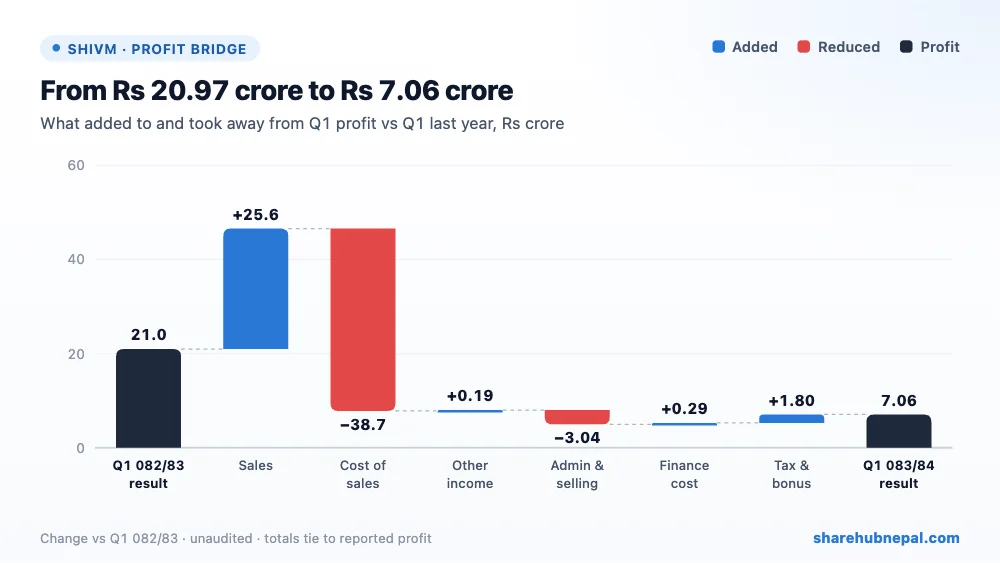
Higher sales added Rs 25.60 crore, but cost of sales took away Rs 38.74 crore more, so gross profit fell Rs 13.15 crore. Admin and selling costs together rose Rs 3.04 crore (admin fell Rs 1.63 crore but selling rose Rs 4.67 crore). Lower finance cost (Rs 29.23 lakh saved) and lower tax (Rs 1.80 crore less) softened the fall. Management blames overcapacity in the cement industry, tough price competition and higher diesel and transport costs.
2. Profit through the year
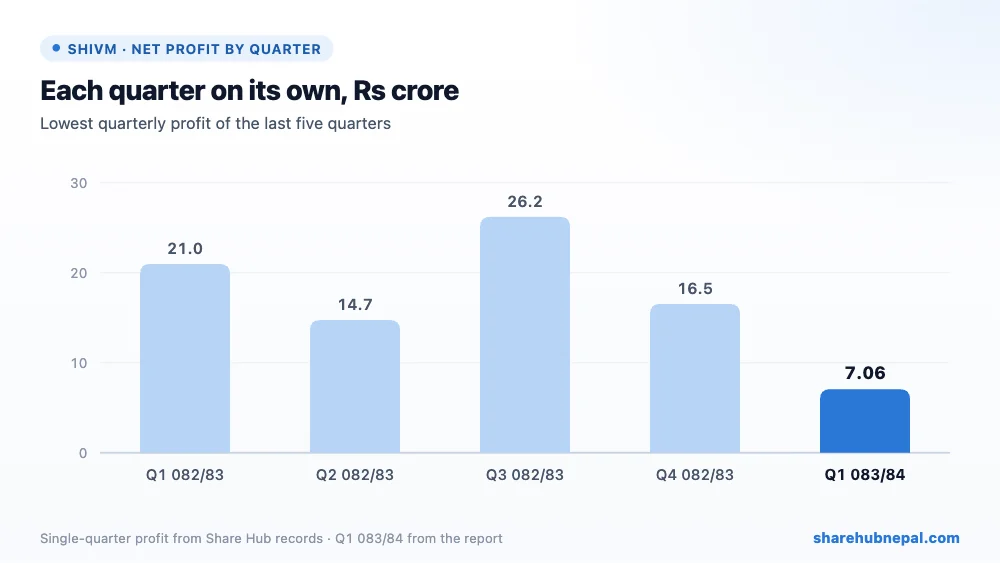
Profit by quarter (Share Hub records): Q1 082/83: Rs 20.97 crore, Q2 082/83: Rs 14.74 crore, Q3 082/83: Rs 26.21 crore, Q4 082/83: Rs 16.53 crore, Q1 083/84: Rs 7.06 crore. FY 2082/83 profit was Rs 78.45 crore (EPS Rs 14.03). This Q1 profit is well below every quarter last year.
3. Debt and balance sheet
| Particulars | Ashwin 2083 | Ashwin 2082 | Change |
| Total assets | Rs 13,363,531,942 | Rs 12,920,369,757 | +3.43% |
| Total equity | Rs 10,628,946,507 | Rs 10,487,021,313 | +1.35% |
| Long-term borrowings | Rs 0 | Rs 1,090,438 | −100.00% |
| Current borrowings | Rs 63,242,467 | Rs 163,848,760 | −61.40% |
| Cash and equivalents | Rs 286,139,602 | Rs 267,362,547 | +7.02% |
| Inventories | Rs 2,415,262,769 | Rs 1,778,825,479 | +35.78% |
| Trade receivables | Rs 817,284,971 | Rs 974,268,125 | −16.11% |
| Investment in subsidiaries | Rs 5,145,208,800 | Rs 4,755,208,800 | +8.20% |
| Trade payables | Rs 1,713,557,749 | Rs 1,550,722,764 | +10.50% |
The balance sheet is strong: equity is Rs 1,062.89 crore against total assets of Rs 1,336.35 crore, and borrowings are only Rs 6.32 crore. Investment in subsidiaries rose to Rs 514.52 crore from Rs 475.52 crore a year ago. Inventories rose 35.78% to Rs 241.53 crore, which ties up cash; trade receivables fell to Rs 81.73 crore. Cash is Rs 28.61 crore (a year ago there was also a Rs 65 crore bank deposit). The current ratio is 1.61.
4. Per-share figures and valuation
| Indicator | Value |
| EPS (annualised) | Rs 5.05 |
| Net worth per share | Rs 190.13 |
| Market price (Ashwin end) | Rs 682.9 |
| P/E (annualised) | 135.23x |
| P/B | 3.59x |
At the Ashwin-end price of Rs 682.9, the share trades at 135.23 times annualised EPS and 3.59 times net worth per share. That is very expensive for current earnings; the price relies on margins recovering and the subsidiary investment paying off.
Conclusion
Positives: sales up 16.69%, almost no debt, finance cost down to Rs 2.90 lakh, admin cost down 26.31%, large equity base and investment in subsidiaries.
Watch: gross margin halved to 10.90%, selling cost up 35.47%, profit down 66.31%, inventories up 35.78%, industry overcapacity and price war, pending court cases (NEA dedicated line charges, natural resource tax, environment fee).
Volumes are growing but price competition is eating the margin; watch whether the gross margin recovers towards 20% in the coming quarters.
Figures are from the company's unaudited Q1 report; quarter trends use Share Hub records. This is not investment advice.

