













Samling Power Company Limited – First Quarter Analysis, FY 2083/84
Unaudited results as on Ashwin end 2083, compared with the same quarter last year (Ashwin end 2082) and with Ashad end 2083.
Summary
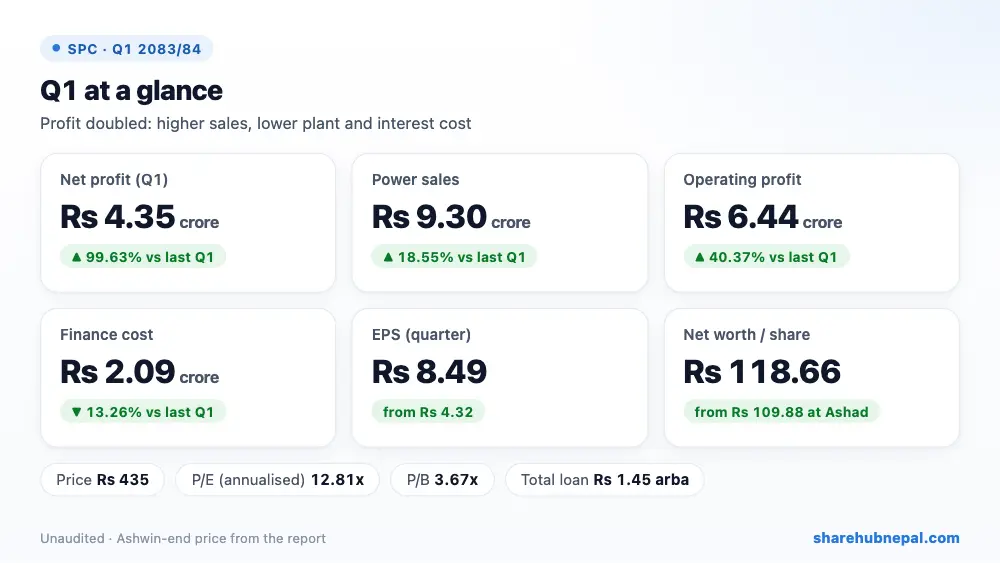
Samling Power earned Rs 4.35 crore in the first quarter of FY 2083/84, double the Rs 2.18 crore of the same quarter last year (up 99.63%). Power sales rose 18.55% to Rs 9.30 crore, cost of sales fell to Rs 67.53 lakh and interest cost fell 13.26%. Quarter EPS is Rs 8.49 (Rs 33.96 annualised) and net worth per share rose to Rs 118.66.
| Indicator | Q1 2083/84 | Q1 2082/83 | Change |
| Revenue from sales | Rs 92,962,939 | Rs 78,418,699 | +18.55% |
| Cost of sales | Rs 6,752,556 | Rs 10,340,359 | −34.70% |
| Other income | Rs 491 | Rs 59 | +732.20% |
| Operating profit | Rs 64,372,628 | Rs 45,859,575 | +40.37% |
| Finance cost | Rs 20,882,515 | Rs 24,073,867 | −13.26% |
| Income tax | Rs 0 | Rs 0 | – |
| Net profit | Rs 43,490,604 | Rs 21,785,767 | +99.63% |
| EPS (quarter) | 8.49 | 4.32 | – |
| Net worth per share | 118.66 | 112 | – |
1. Where the profit came from
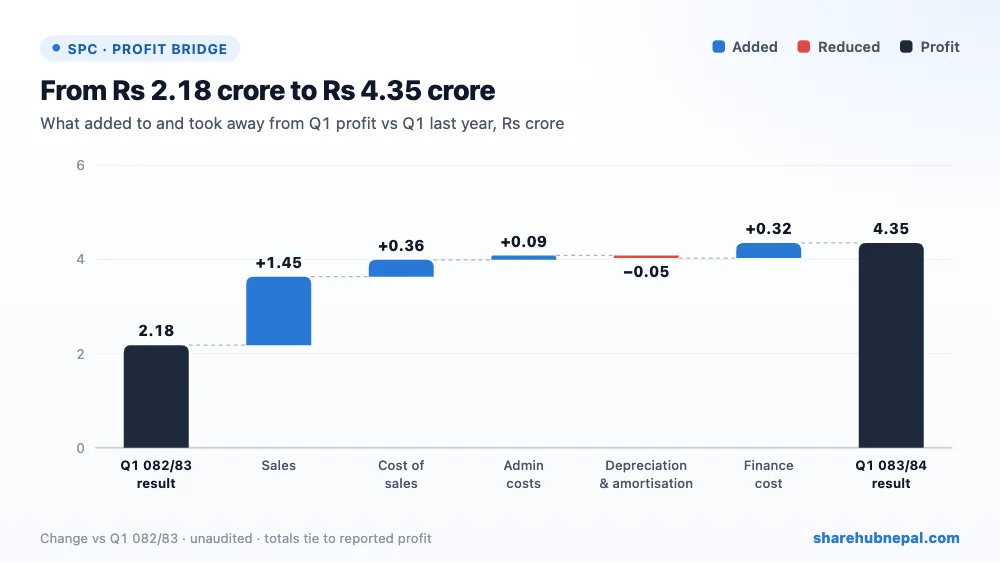
Higher sales added Rs 1.45 crore to profit. Lower cost of sales added Rs 35.88 lakh, lower interest Rs 31.91 lakh and lower admin cost Rs 9.22 lakh. Amortisation rose Rs 5.41 lakh. The plant ran fully in the quarter, and the company says it received an assessed loss-of-profit insurance claim of Rs 1.71 crore; the report does not say whether it is inside revenue.
2. Profit through the year
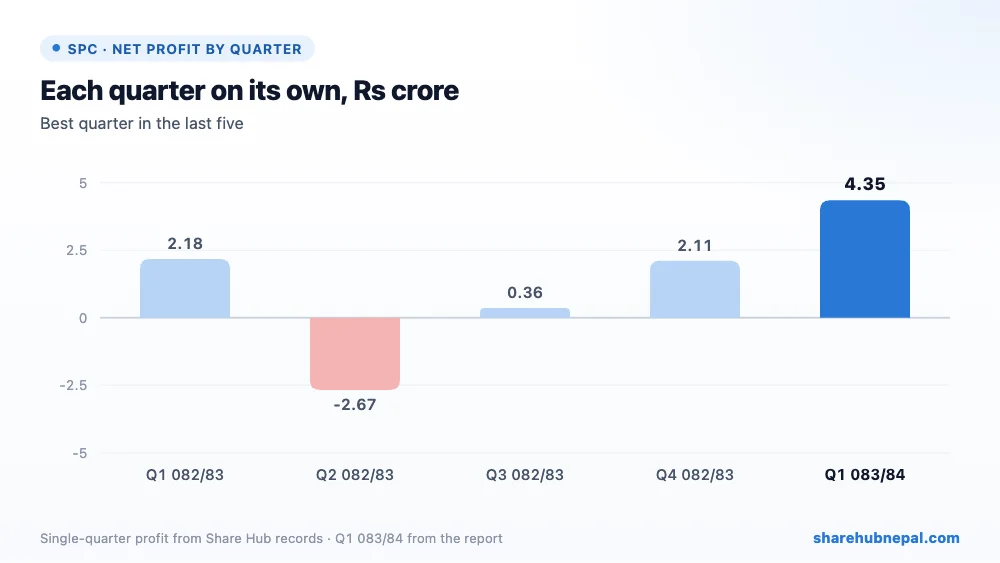
Profit by quarter (Share Hub records): Q1 082/83: Rs 2.18 crore, Q2 082/83: −Rs 2.67 crore, Q3 082/83: Rs 36.46 lakh, Q4 082/83: Rs 2.11 crore, Q1 083/84: Rs 4.35 crore. Profit is seasonal: the dry-season Q2 made a loss of Rs 2.67 crore last year. FY 2082/83 EPS was only Rs 2.19, so the annualised Q1 figure overstates the full year.
3. Debt and balance sheet
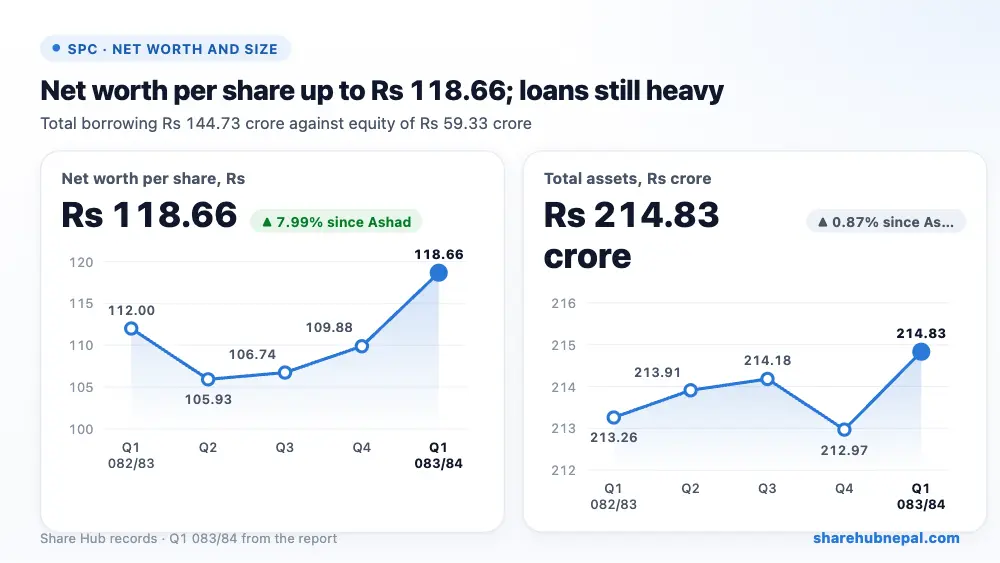
| Particulars | Ashwin 2083 | Ashad 2083 | Change |
| Total assets | Rs 2,148,258,022 | Rs 2,129,734,254 | +0.87% |
| Total equity | Rs 593,302,117 | Rs 549,399,418 | +7.99% |
| Long-term borrowings | Rs 1,306,117,348 | Rs 1,349,714,881 | −3.23% |
| Current borrowings | Rs 141,202,552 | Rs 128,678,578 | +9.73% |
| Cash and equivalents | Rs 50,273,225 | Rs 17,253,360 | +191.38% |
Total assets are Rs 2.15 arba, mostly the Rs 1.97 arba concession asset. Long-term loan fell to Rs 1.31 arba from Rs 1.35 arba while short-term borrowing rose to Rs 14.12 crore. Cash rose to Rs 5.03 crore from Rs 1.73 crore. Current ratio is 0.67, so short-term dues are larger than short-term assets.
4. Per-share figures and valuation
| Indicator | Value |
| EPS (annualised) | Rs 33.96 |
| Net worth per share | Rs 118.66 |
| Market price (Ashwin end) | Rs 435 |
| P/E (annualised) | 12.81x |
| P/B | 3.67x |
At the Ashwin-end price of Rs 435, the share trades at 12.81 times annualised EPS and 3.67 times net worth per share. The report's own P/E of 51.25 uses the single-quarter EPS. On last year's full-year EPS of Rs 2.19 the price looks expensive; the annualised figure is flattered by the wet season.
Conclusion
Positives: profit doubled, sales up 18.55%, lower cost of sales and interest, cash up, net worth per share up to Rs 118.66.
Watch: high debt (Rs 144.73 crore against Rs 59.33 crore equity), current ratio 0.67, dry-season losses that usually follow, and a P/E above 50 on quarter EPS.
A strong wet-season quarter with real cost savings. The full-year result will depend on the dry months, when this plant has made losses before.
Figures are from the company's unaudited Q1 report; quarter trends use Share Hub records. This is not investment advice.

