













Terhathum Power Company Limited – First Quarter Analysis, FY 2083/84
Unaudited results as on Ashwin end 2083, compared with the same quarter last year (Ashwin end 2082) and with Ashad end 2083.
Summary
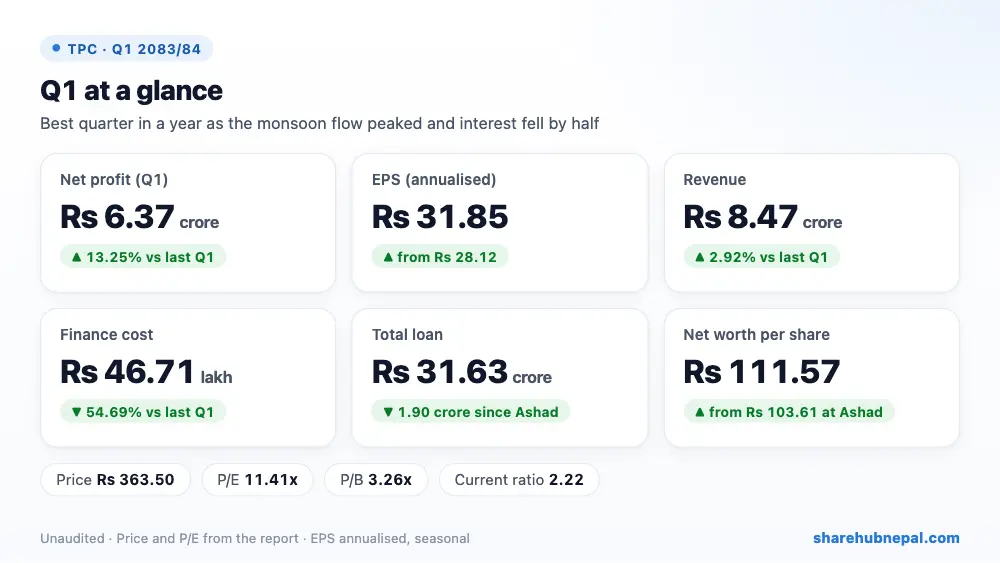
Terhathum Power, which runs the 7.5 MW Upper Khorunga Khola project, earned a net profit of Rs 6.37 crore in the first quarter, up 13.25% from Rs 5.62 crore a year ago. Annualised EPS is Rs 31.85.
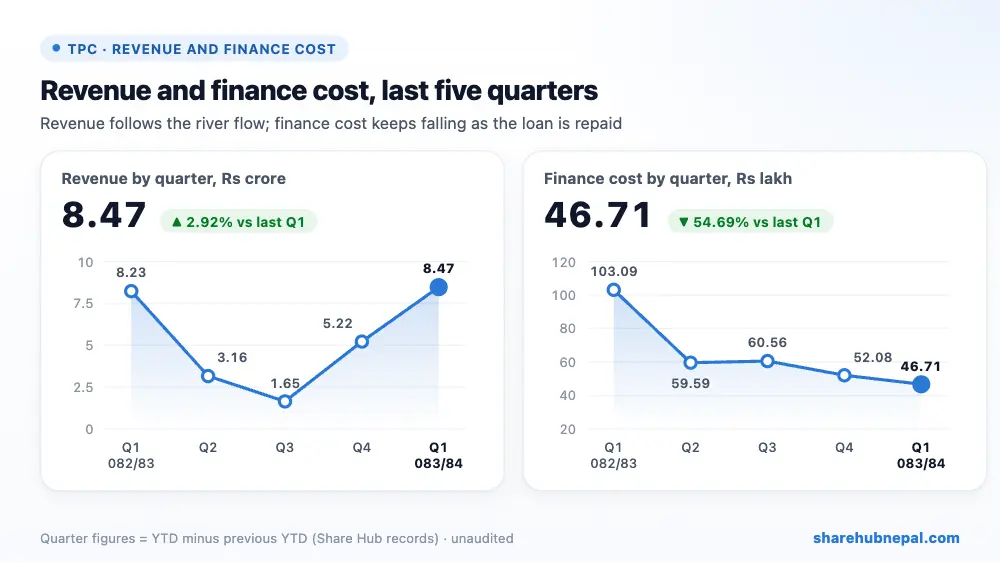
Revenue rose only 2.92% to Rs 8.47 crore, so most of the gain came from interest: finance cost fell 54.69% to Rs 46.71 lakh as the loan keeps being repaid. The company pays no income tax at present, and the net profit margin rose to 75.20% from 68.34%. It still sells power to NEA on a take-and-pay basis (it will move to take-or-pay once NEA's conditions are met).
| Indicator | Q1 2083/84 | Q1 2082/83 | Change |
| Revenue from operation | Rs 84,713,328 | Rs 82,307,757 | +2.92% |
| Cost of sales | Rs 14,740,403 | Rs 14,589,246 | +1.04% |
| Profit from operations | Rs 68,371,469 | Rs 66,556,450 | +2.73% |
| Finance cost | Rs 4,670,770 | Rs 10,308,776 | −54.69% |
| Net profit | Rs 63,700,700 | Rs 56,247,674 | +13.25% |
| EPS (annualised) | 31.85 | 28.12 | – |
1. Where the profit came from
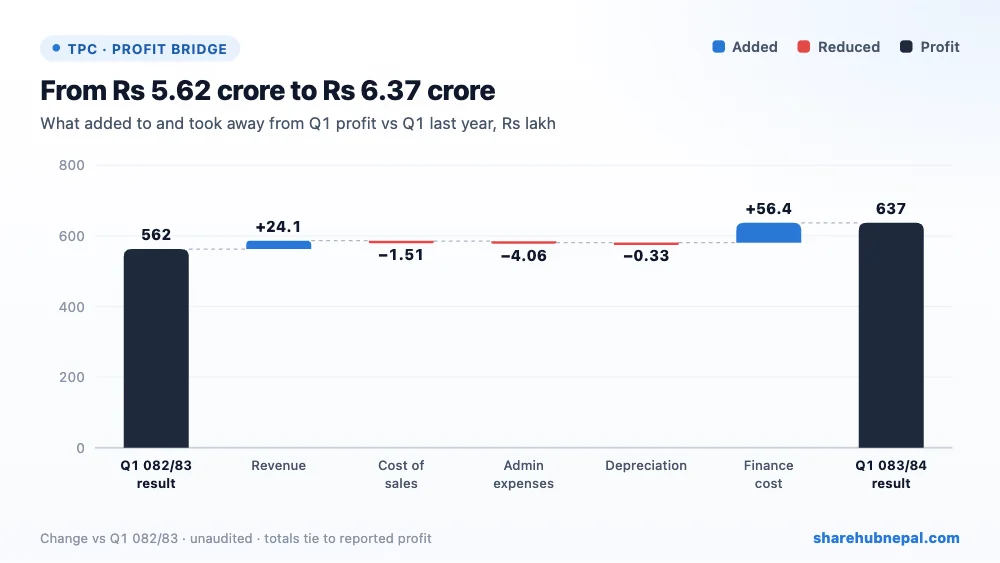
Compared with last year's Q1, lower finance cost added Rs 56.38 lakh and higher revenue Rs 24.06 lakh. Higher administrative expenses took away Rs 4.06 lakh, and cost of sales and depreciation about Rs 1.84 lakh together.
2. Profit through the year
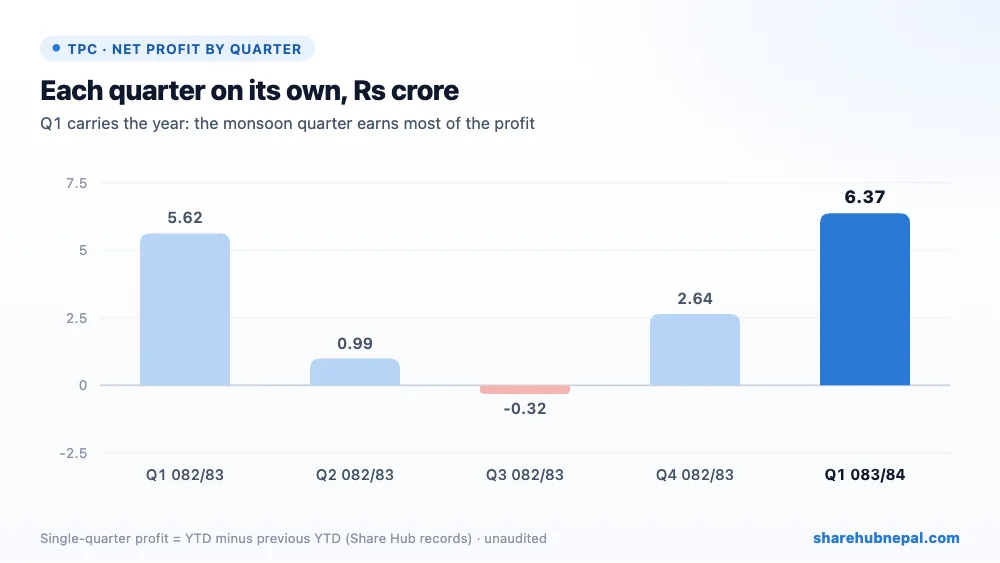
Based on Share Hub's records, single-quarter results in 2082/83 were a profit of Rs 5.62 crore in Q1, Rs 99.01 lakh in Q2, a loss of Rs 32.00 lakh in Q3 and a profit of Rs 2.64 crore in Q4 (full year Rs 8.93 crore). The monsoon quarter earns most of the year's profit, so annualising Q1 overstates the full year.
3. Debt and balance sheet
| Particulars | Ashwin 2083 | Ashad 2083 | Change |
| Long-term loans (incl. current portion) | Rs 316,276,428 | Rs 335,233,651 | −5.65% |
| Project (intangible) assets | Rs 1,030,271,189 | Rs 1,040,699,466 | −1.00% |
| Investment | Rs 45,250,000 | Rs 34,750,000 | +30.22% |
| Trade and other receivables | Rs 54,671,760 | Rs 41,680,444 | +31.17% |
| Cash and cash equivalents | Rs 45,299,513 | Rs 13,199,351 | +243.20% |
| Total assets | Rs 1,220,380,853 | Rs 1,175,756,011 | +3.80% |
| Total equity | Rs 892,554,074 | Rs 828,853,374 | +7.69% |
Total loan fell to Rs 31.63 crore from Rs 33.52 crore at Ashad end (Rs 26.40 crore long-term plus Rs 5.23 crore due within a year), only 0.35 times equity. Cash rose to Rs 4.53 crore and investments to Rs 4.53 crore. Equity grew by the full quarter's profit to Rs 89.26 crore, and net worth per share rose to Rs 111.57. The report's Ashad-end figures (FY profit Rs 8.91 crore) are slightly different from Share Hub's Q4 record (Rs 8.93 crore).
4. Per-share figures and valuation
| Indicator | Value |
| EPS (annualised) | Rs 31.85 |
| EPS (quarter) | Rs 7.96 |
| Net worth per share | Rs 111.57 |
| Market price (report) | Rs 363.50 |
| P/E (report) | 11.41x |
| P/B | 3.26x |
| Current ratio | 2.22 |
At Rs 363.50 the share trades at 11.41 times annualised EPS (as reported) and 3.26 times net worth per share. Because Q1 is the peak season, the P/E on full-year earnings will be much higher; on last year's EPS of Rs 11.17 it is about 32.5.
Conclusion
Positives: profit up 13.25%, finance cost halved, loan being repaid steadily, low debt (0.35x equity), good liquidity (current ratio 2.22) and net worth rising above face value.
Watch: revenue growth of only 2.92%, a seasonal Q1 that overstates the annual EPS, sales still on a take-and-pay basis, higher administrative costs, and a P/B of 3.26x.
Terhathum Power had a solid monsoon quarter, helped mostly by a falling interest bill. The dry-season quarters will decide the full-year EPS, and a move to take-or-pay sales would make income more stable.
Figures are from the company's unaudited Q1 report; quarter trends use Share Hub records. This is not investment advice.

