













Taragaon Regency Hotels Limited – First Quarter Analysis, FY 2083/84
Unaudited results as on Ashwin end 2083, compared with the same quarter last year (Ashwin end 2082) and with Ashad end 2083.
Summary
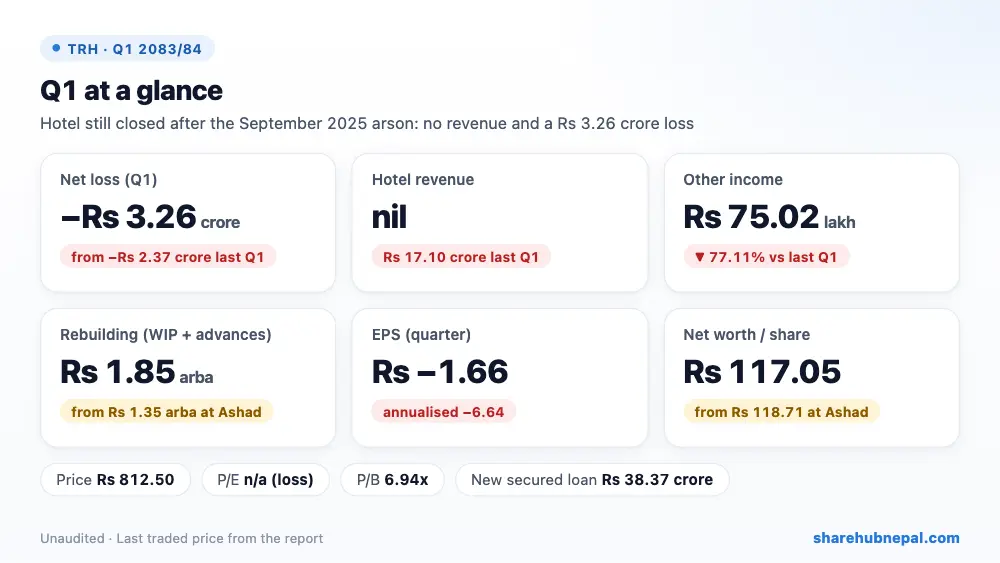
Taragaon Regency Hotels, which owns the Hyatt Regency Kathmandu, made a net loss of Rs 3.26 crore in the first quarter of FY 2083/84, against a loss of Rs 2.37 crore a year ago. Quarter EPS is Rs −1.66.,The hotel has earned no operating revenue since it was vandalised, looted and set on fire during the protests of 9 September 2025 (24 Bhadra 2082). Its only income this quarter was Rs 75.02 lakh of other income (Rs 3.28 crore last year). With the hotel shut, operating costs fell to Rs 1.63 crore and admin overhead to Rs 88.30 lakh, but that still left a loss of Rs 1.77 crore before depreciation, and Rs 1.49 crore of depreciation made the net loss Rs 3.26 crore. The company says the hotel cannot reopen for normal business until repairs and upgrades are finished, which it aims to do within this fiscal year.
| Indicator | Q1 2083/84 | Q1 2082/83 | Change |
| Revenue from operations | Rs 0 | Rs 171,044,676 | −100.00% |
| Other income | Rs 7,501,596 | Rs 32,776,200 | −77.11% |
| Operational expense and other costs | Rs 16,336,452 | Rs 155,995,320 | −89.53% |
| Administrative overhead | Rs 8,829,959 | Rs 48,311,777 | −81.72% |
| Profit before depreciation and tax | −Rs 17,664,815 | −Rs 486,220 | −3533.09% |
| Depreciation and amortisation | Rs 14,900,486 | Rs 23,256,662 | −35.93% |
| Net loss | −Rs 32,565,301 | −Rs 23,742,882 | −37.16% |
| EPS (quarter) | -1.66 | -1.21 | – |
1. Where the profit came from
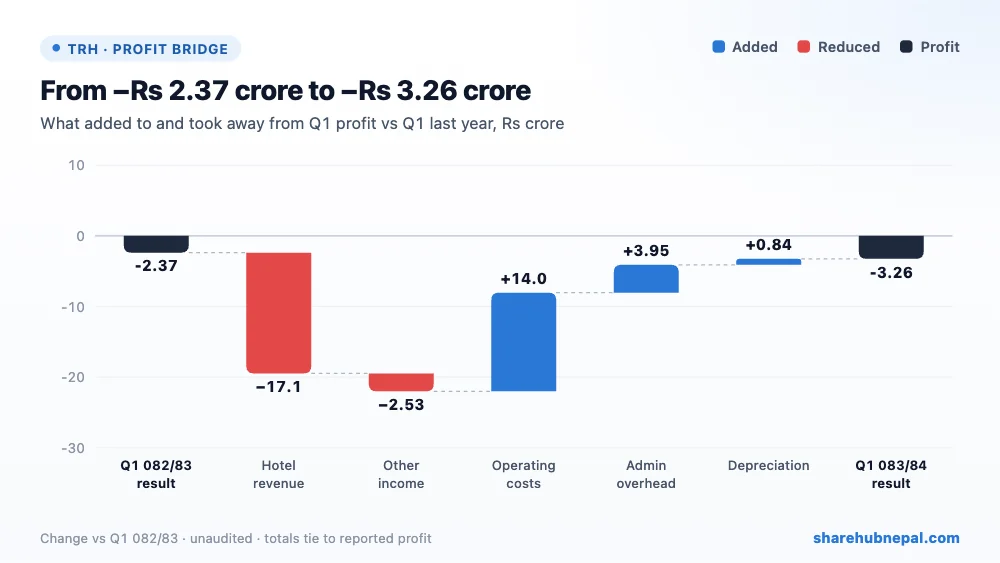
Compared with last year's Q1, hotel revenue of Rs 17.10 crore and Rs 2.53 crore of other income were lost, while operating costs fell by Rs 13.97 crore, admin by Rs 3.95 crore and depreciation by Rs 83.56 lakh (damaged assets were written off last year). The net effect is a loss Rs 88.22 lakh bigger than a year ago.
2. Profit through the year
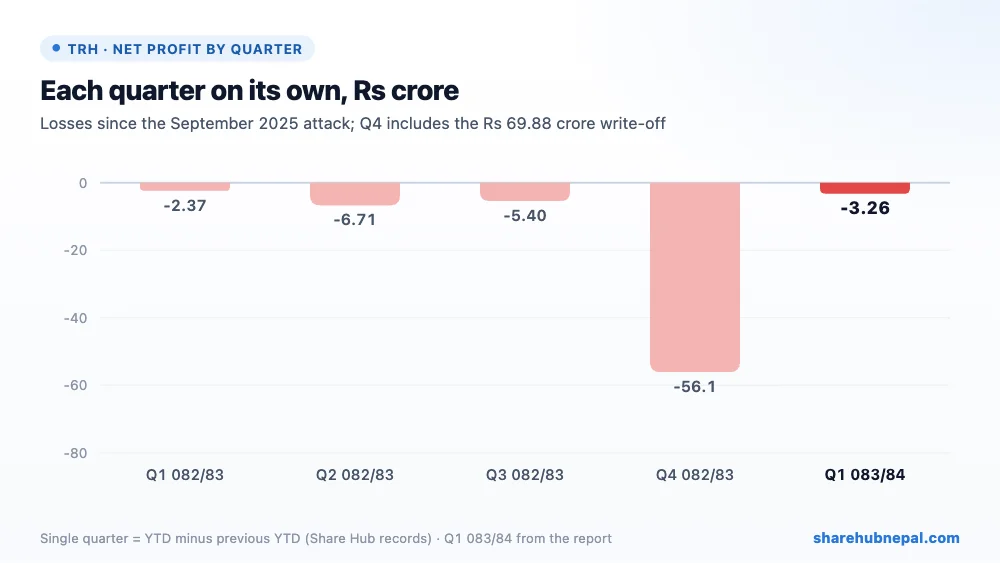
The hotel has lost money in every quarter since the attack: last year Rs 2.37 crore in Q1, Rs 6.71 crore in Q2, Rs 5.40 crore in Q3 and Rs 56.10 crore in Q4, which included a Rs 69.88 crore loss on damaged property. The full-year loss was Rs 70.58 crore (EPS Rs −35.97).
3. Debt and balance sheet
| Particulars | Ashwin 2083 | Ashad 2083 | Change |
| Property, plant and equipment | Rs 977,232,782 | Rs 990,761,877 | −1.37% |
| Work in progress (rebuilding) | Rs 1,396,978,774 | Rs 1,199,482,793 | +16.47% |
| Advance to suppliers (capital works) | Rs 448,358,330 | Rs 148,748,062 | +201.42% |
| Investments | Rs 600,094,445 | Rs 800,594,445 | −25.04% |
| Cash and cash equivalents | Rs 21,509,371 | Rs 60,146,590 | −64.24% |
| Secured loan | Rs 383,650,000 | Rs 0 | – |
| Trade and other payables | Rs 956,113,150 | Rs 1,070,459,784 | −10.68% |
| Total equity | Rs 2,296,584,469 | Rs 2,329,149,770 | −1.40% |
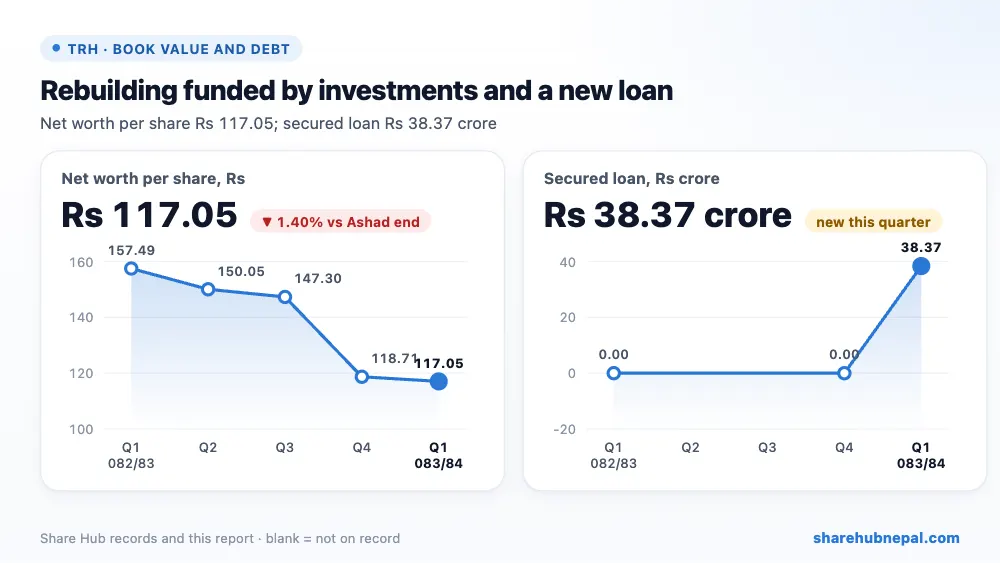
The rebuilding is moving: work in progress rose to Rs 1.40 arba and advances to suppliers to Rs 44.84 crore. To pay for it, the company drew down investments (Rs 60.01 crore, from Rs 80.06 crore at Ashad end and Rs 1.57 arba a year ago) and took a new secured loan of Rs 38.37 crore. Cash fell to Rs 2.15 crore and the liquidity ratio is 0.97, with Rs 95.61 crore owed to trade and other creditors. Equity is Rs 2.30 arba, or Rs 117.05 per share.
4. Per-share figures and valuation
| Indicator | Value |
| EPS (quarter, report) | Rs -1.66 |
| Net worth per share (report) | Rs 117.05 |
| Last price (Ashwin end) | Rs 812.50 |
| P/B | 6.94x |
| Liquidity ratio (report) | 0.97 |
At Rs 812.50 the share trades at 6.94 times net worth per share with no earnings at all. The price reflects hopes of a full reopening of a premium hotel, not current results.
Conclusion
Positives: repairs and upgrades are under way with work in progress of Rs 1.40 arba, costs were cut sharply while closed, equity is still Rs 2.30 arba, and there are no legal cases.
Watch: no hotel revenue until reopening, a new Rs 38.37 crore loan and falling investments, a liquidity ratio below 1 with large payables, the timing of reopening, and a price far above book value.
Watch the reopening date, the final repair cost and how it is funded, and any insurance recovery for the damage.
Figures are from the company's unaudited Q1 report; quarter trends use Share Hub records. This is not investment advice.

