













United Idi Mardi and RB Hydropower Ltd – First Quarter Analysis, FY 2083/84
Unaudited results as on Ashwin end 2083, compared with the same quarter last year (Ashwin end 2082) and with Ashad end 2083.
Summary
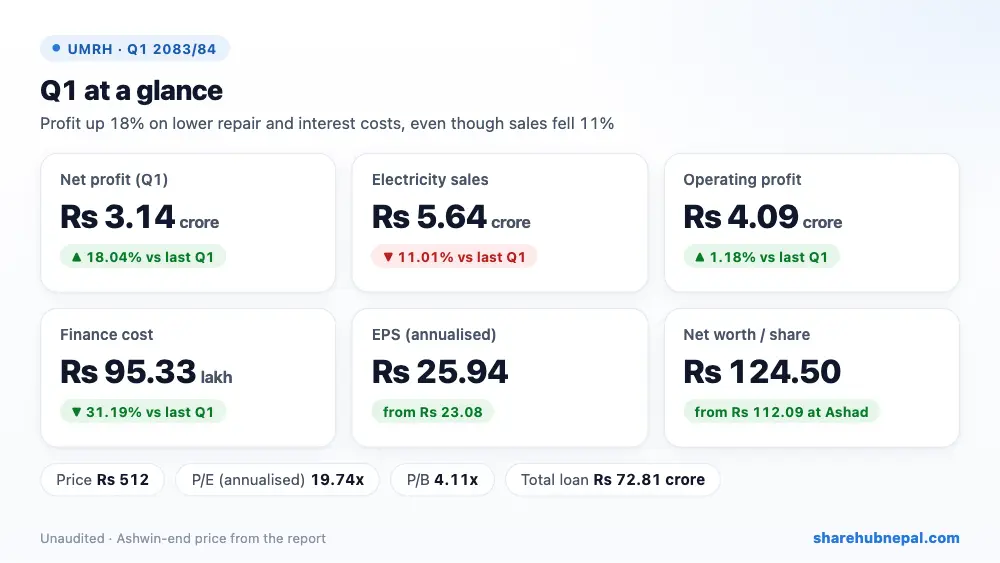
United Idi Mardi and RB Hydropower earned Rs 3.14 crore in the first quarter, up 18.04% from Rs 2.66 crore a year ago. Power sales actually fell 11.01% to Rs 5.64 crore, but costs fell faster: project operating (repair and maintenance) expenses dropped from Rs 1.16 crore to Rs 41.94 lakh and finance cost fell 31.19% to Rs 95.33 lakh. Management says the lower repair and interest costs explain the higher profit. Annualised EPS is Rs 25.94.
| Indicator | Q1 2083/84 | Q1 2082/83 | Change |
| Revenue from sales | Rs 56,362,456 | Rs 63,338,196 | −11.01% |
| Cost of sales | Rs 4,194,388 | Rs 11,568,760 | −63.74% |
| Other income | Rs 0 | Rs 0 | – |
| Operating profit | Rs 40,915,151 | Rs 40,439,407 | +1.18% |
| Finance cost | Rs 9,532,927 | Rs 13,853,350 | −31.19% |
| Income tax | Rs 0 | Rs 0 | – |
| Net profit | Rs 31,382,224 | Rs 26,586,056 | +18.04% |
| EPS (annualised) | 25.94 | 23.08 | – |
| Net worth per share | 124.5 | 111.73 | – |
1. Where the profit came from
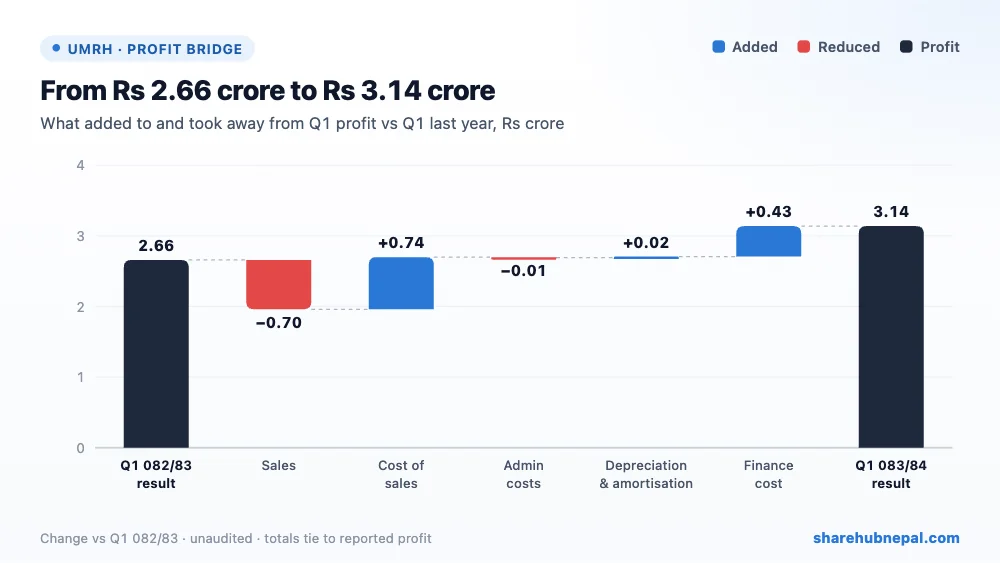
Profit rose by Rs 47.96 lakh. Lower project operating expenses added Rs 73.74 lakh and lower finance cost Rs 43.20 lakh. Lower power sales took away Rs 69.76 lakh. Admin cost and depreciation were almost unchanged. Because the saving came from lower repair spending, part of it may not repeat every quarter.
2. Profit through the year
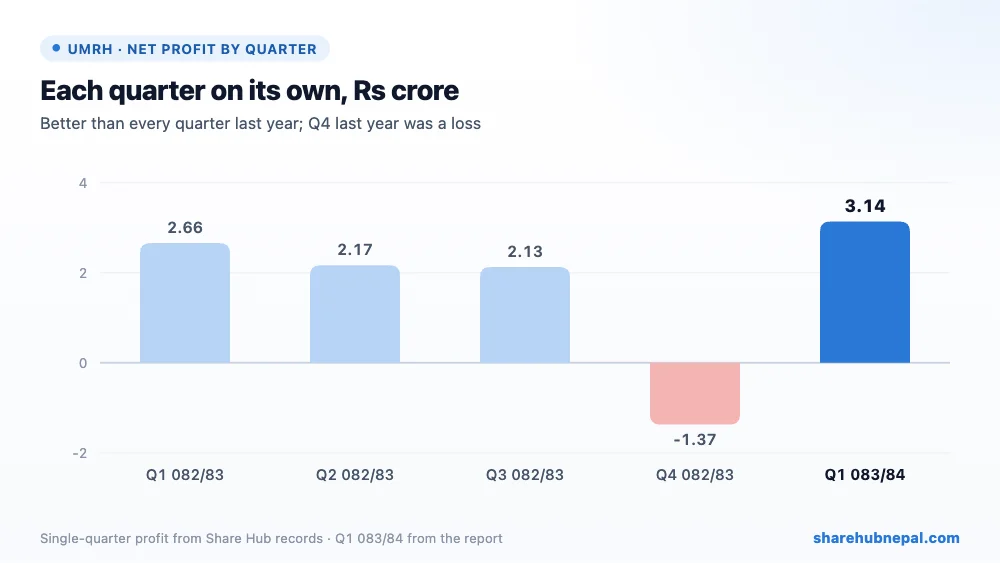
Profit by quarter (Share Hub records): Q1 082/83: Rs 2.66 crore, Q2 082/83: Rs 2.17 crore, Q3 082/83: Rs 2.13 crore, Q4 082/83: −Rs 1.37 crore, Q1 083/84: Rs 3.14 crore. Last year Q4 was a loss of Rs 1.37 crore (by Share Hub records), so the full-year profit was only Rs 5.58 crore (EPS Rs 11.53).
3. Debt and balance sheet
| Particulars | Ashwin 2083 | Ashad 2083 | Change |
| Total assets | Rs 1,428,190,569 | Rs 1,403,057,656 | +1.79% |
| Total equity | Rs 573,724,605 | Rs 542,342,381 | +5.79% |
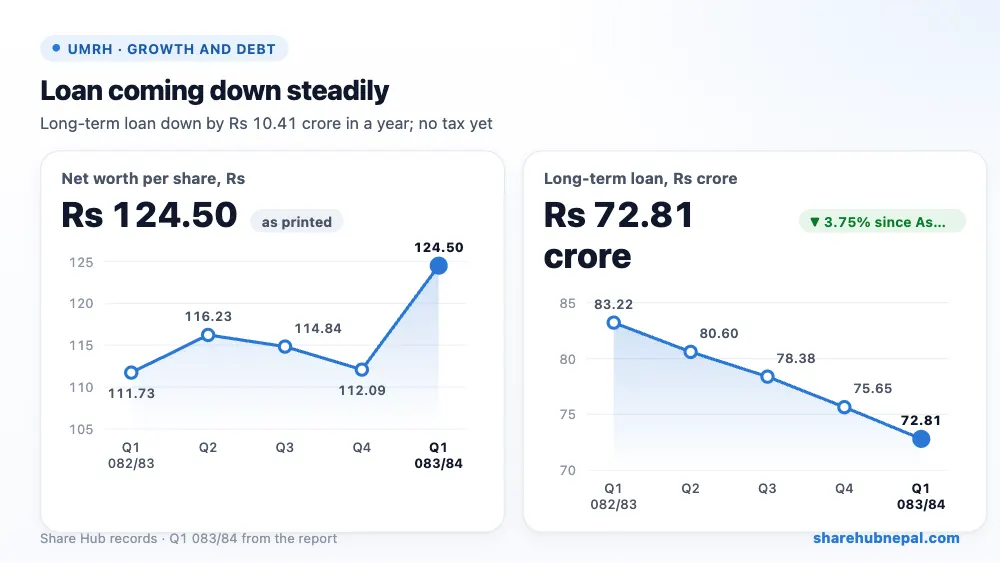
| Long-term borrowings | Rs 728,081,399 | Rs 756,450,098 | −3.75% |
| Cash and equivalents | – | – | – |
The long-term loan fell to Rs 72.81 crore from Rs 75.65 crore at Ashad end and Rs 83.22 crore a year ago, against equity of Rs 57.37 crore, so debt is still about 1.3 times equity. Current liabilities (Rs 12.64 crore) are larger than current assets (Rs 7.23 crore), so short-term cash is tight. Paid-up capital is Rs 48.39 crore after a 5% bonus share. The report prints net worth per share of Rs 124.50, but equity divided by shares gives Rs 118.57.
4. Per-share figures and valuation
| Indicator | Value |
| EPS (annualised) | Rs 25.94 |
| Net worth per share | Rs 124.50 |
| Market price (Ashwin end) | Rs 512 |
| P/E (annualised) | 19.74x |
| P/B | 4.11x |
At the Ashwin-end price of Rs 512, the share trades at 19.74 times annualised EPS and 4.11 times net worth per share. Last year the full-year EPS was only Rs 11.53, so on a full-year view the P/E is about 44x.
Conclusion
Positives: profit up 18%, much lower repair and interest costs, loan falling steadily, no income tax.
Watch: power sales down 11% in the peak season, current liabilities above current assets, a loss in last year's Q4, and a printed net worth per share that does not match the balance sheet.
A better quarter thanks to cost control, but lower generation is a concern. Watch whether sales recover and whether the dry-season quarters stay profitable this year.
Figures are from the company's unaudited Q1 report; quarter trends use Share Hub records. This is not investment advice.

