













Barun Hydropower Company Limited – First Quarter Analysis, FY 2083/84
Unaudited results as on Ashwin end 2083, compared with the same quarter last year (Ashwin end 2082) and with Ashad end 2083.
Summary
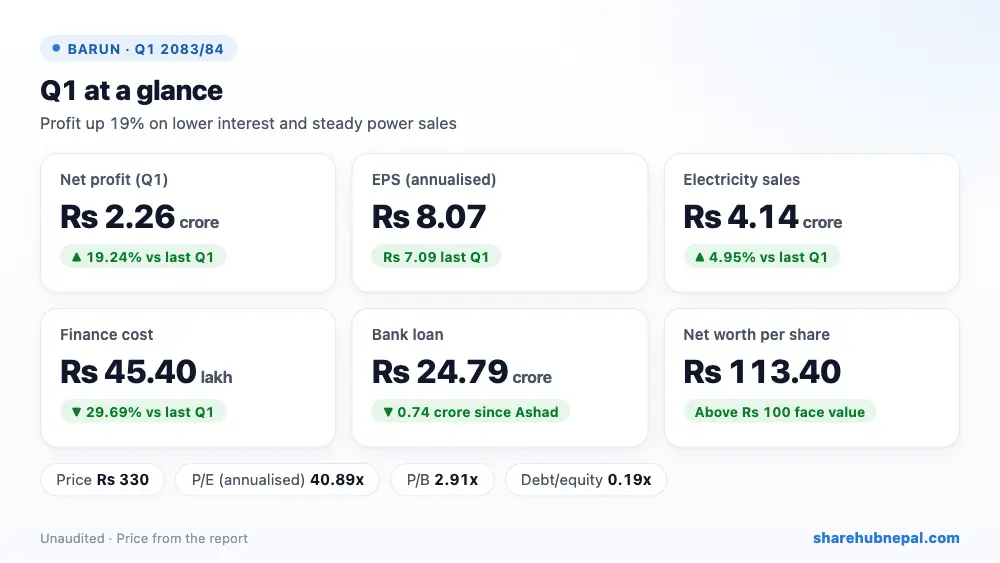
Barun Hydropower (Hewa Khola small hydropower project) earned a net profit of Rs 2.26 crore in the first quarter, up 19.24% from Rs 1.90 crore a year ago. Annualised EPS is Rs 8.07.
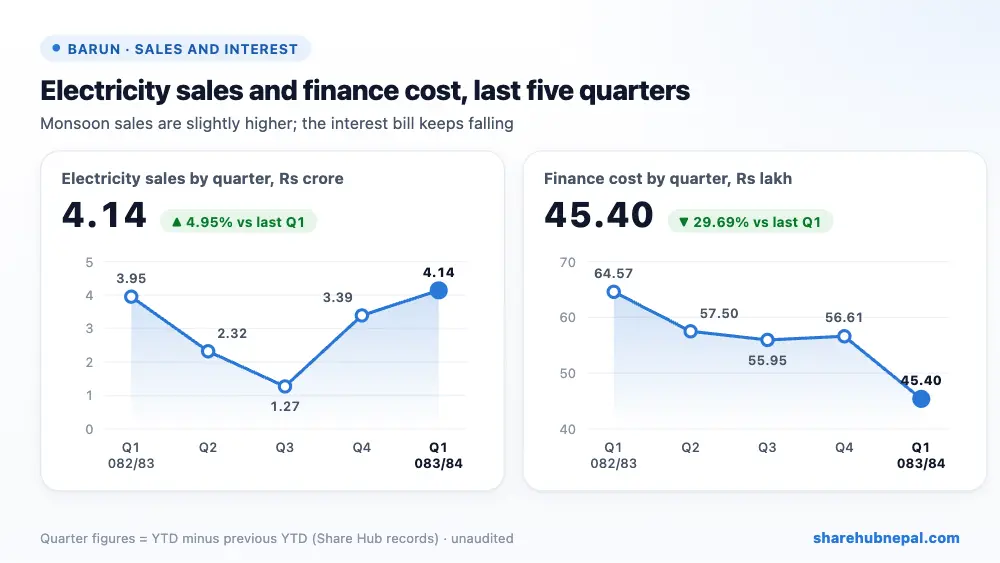
Electricity sales rose 4.95% to Rs 4.14 crore and finance cost fell 29.69% to Rs 45.40 lakh after short-term borrowing was repaid. Administrative expenses fell 14.18%, while a staff bonus provision of Rs 4.62 lakh was made this year. No tax was charged in the quarter.
| Indicator | Q1 2083/84 | Q1 2082/83 | Change |
| Electricity sales | Rs 41,426,019 | Rs 39,473,754 | +4.95% |
| Gross profit | Rs 35,005,806 | Rs 33,306,251 | +5.10% |
| Operating profit | Rs 32,797,040 | Rs 30,747,783 | +6.66% |
| Finance cost | Rs 4,540,042 | Rs 6,457,199 | −29.69% |
| Net profit | Rs 22,644,858 | Rs 18,990,584 | +19.24% |
| EPS (annualised) | 8.07 | 7.09 | – |
1. Where the profit came from
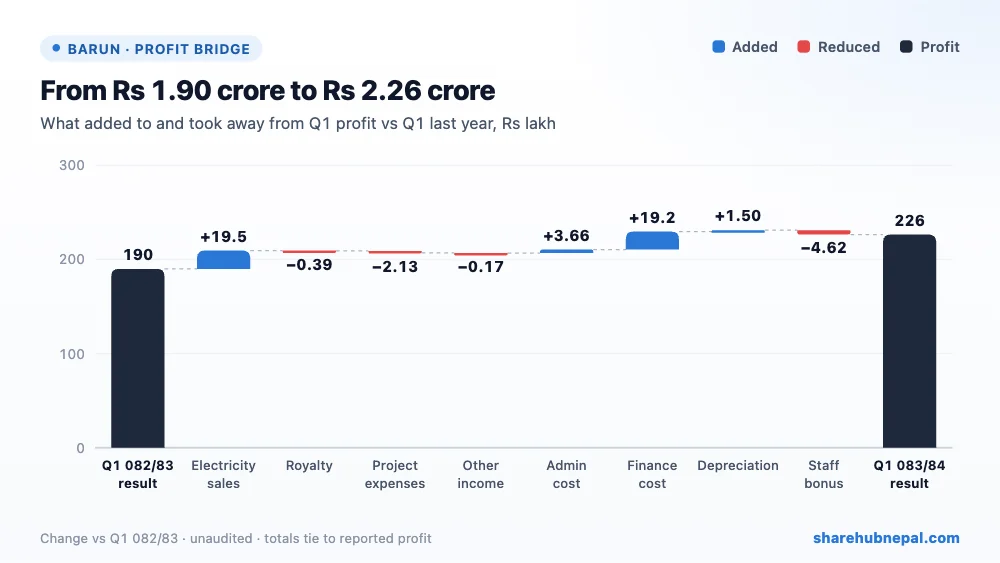
Compared with last year's Q1, higher sales added Rs 19.52 lakh, lower finance cost Rs 19.17 lakh, lower administrative cost Rs 3.66 lakh and lower depreciation Rs 1.50 lakh. The new staff bonus took away Rs 4.62 lakh, higher project expenses Rs 2.13 lakh and higher royalty Rs 39,320.
2. Profit through the year
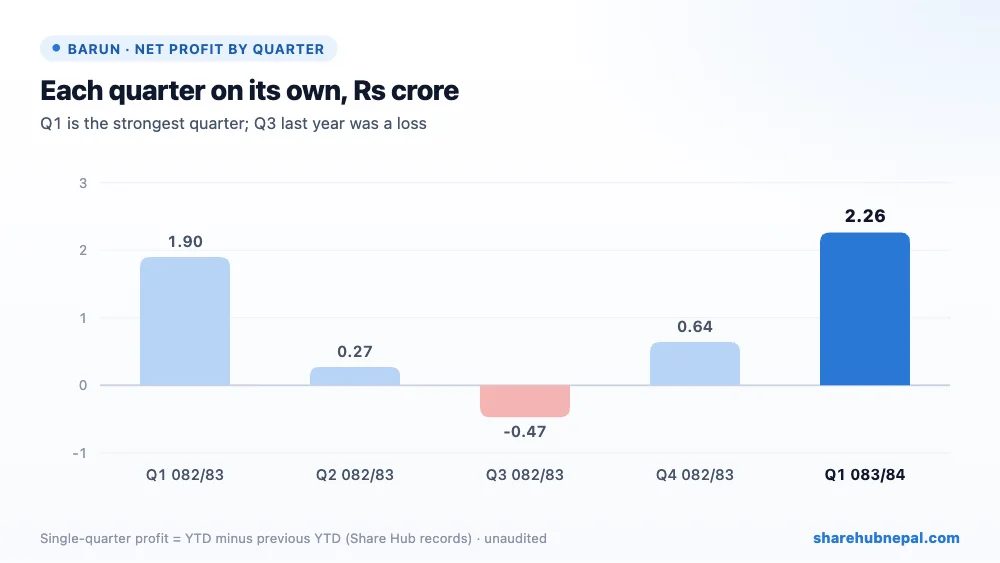
Based on Share Hub's records, single-quarter profits in 2082/83 were Rs 1.90 crore in Q1, Rs 27.05 lakh in Q2, a loss of Rs 47.42 lakh in Q3 and a profit of Rs 64.13 lakh in Q4, for a full-year profit of Rs 2.34 crore. This one quarter has earned almost as much as all of last year.
3. Debt and balance sheet
| Particulars | Ashwin 2083 | Ashad 2083 | Change |
| Secured consortium loans | Rs 247,889,015 | Rs 224,714,557 | +10.31% |
| Short-term borrowings | Rs 0 | Rs 30,589,754 | −100.00% |
| Investments (subsidiaries and shares) | Rs 650,868,767 | Rs 649,758,268 | +0.17% |
| Advance, loan and deposits | Rs 262,531,928 | Rs 275,758,011 | −4.80% |
| Total assets | Rs 1,536,764,529 | Rs 1,490,067,877 | +3.13% |
| Total equity | Rs 1,272,906,111 | Rs 1,214,441,493 | +4.81% |
The Rs 3.06 crore short-term borrowing at Ashad end has been repaid, while the consortium loan rose to Rs 24.79 crore, so total debt fell Rs 74.15 lakh and is only 0.19 times equity. The company holds Rs 65.09 crore of investments in subsidiaries and shares and Rs 26.25 crore of advances and deposits. Equity rose to Rs 127.29 crore; retained earnings grew by more than the quarter's profit, which the report does not explain.
4. Per-share figures and valuation
| Indicator | Value |
| EPS (annualised) | Rs 8.07 |
| Net worth per share | Rs 113.40 |
| Total assets per share | Rs 136.90 |
| Market price (report) | Rs 330 |
| P/E on annualised EPS | 40.89x |
| P/B | 2.91x |
| Liquidity ratio (as reported) | 25.85 |
At Rs 330 the share trades at 40.89 times annualised EPS and 2.91 times net worth per share (the report's own P/E of 37.19 appears to use the quarter's lowest price). Last year's full-year EPS was only Rs 2.08, so the monsoon quarter overstates full-year earnings.
Conclusion
Positives: profit up 19.24%, finance cost down 29.69%, short-term debt repaid, very low debt (0.19 times equity), and net worth above face value.
Watch: only 4.95% sales growth, weak dry-season quarters (a loss in Q3 last year), large investments and advances outside the power plant, an unexplained jump in retained earnings, and a P/E above 40.
Barun Hydropower had a solid monsoon quarter with lower interest costs and little debt. Its results over the year depend on the dry season and on how its investments in subsidiaries pay off.
Figures are from the company's unaudited Q1 report; quarter trends use Share Hub records. This is not investment advice.

