













Bindhyabasini Hydropower Development Company Limited – First Quarter Analysis, FY 2083/84
Unaudited results as on Ashwin end 2083, compared with the same quarter last year (Ashwin end 2082) and with Ashad end 2083.
Summary
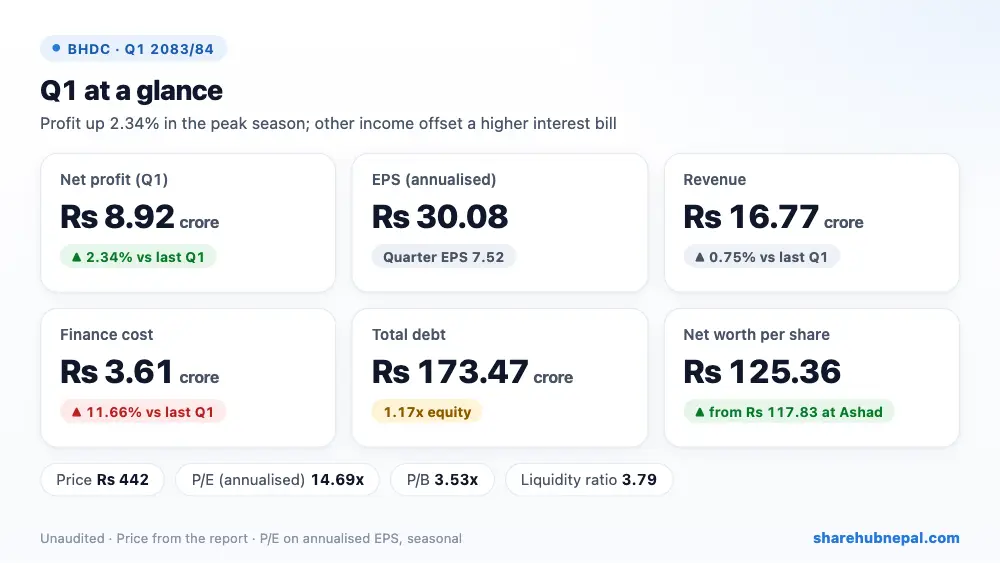
Bindhyabasini Hydropower earned a net profit of Rs 8.92 crore in the first quarter, up 2.34% from Rs 8.72 crore a year ago. Quarter EPS is Rs 7.52 (Rs 30.08 annualised); last year's Q1 EPS on the shares in issue then was Rs 7.72.
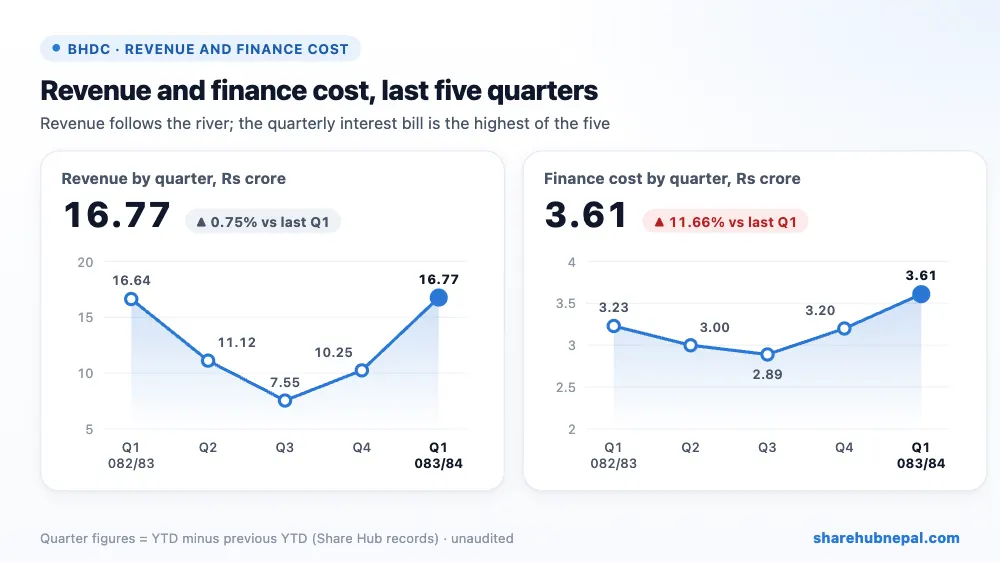
Revenue was almost flat at Rs 16.77 crore (+0.75%). Finance cost rose 11.66% to Rs 3.61 crore because borrowings are higher than a year ago, and income tax of Rs 11.50 lakh was charged. The profit still grew because of Rs 52.18 lakh of other income (the report does not say what it is) and slightly lower administrative costs.
| Indicator | Q1 2083/84 | Q1 2082/83 | Change |
| Revenue | Rs 167,689,073 | Rs 166,446,007 | +0.75% |
| Other income | Rs 5,218,408 | Rs 2,540 | +205349.13% |
| Administrative, other operating and repair expenses | Rs 15,815,757 | Rs 16,291,874 | −2.92% |
| Amortisation and depreciation | Rs 26,915,623 | Rs 26,955,808 | −0.15% |
| Profit before finance cost and tax | Rs 126,432,352 | Rs 119,479,168 | +5.82% |
| Finance cost | Rs 36,063,236 | Rs 32,296,104 | +11.66% |
| Net profit | Rs 89,218,975 | Rs 87,182,429 | +2.34% |
| EPS (quarter) | 7.52 | 7.72 | – |
1. Where the profit came from
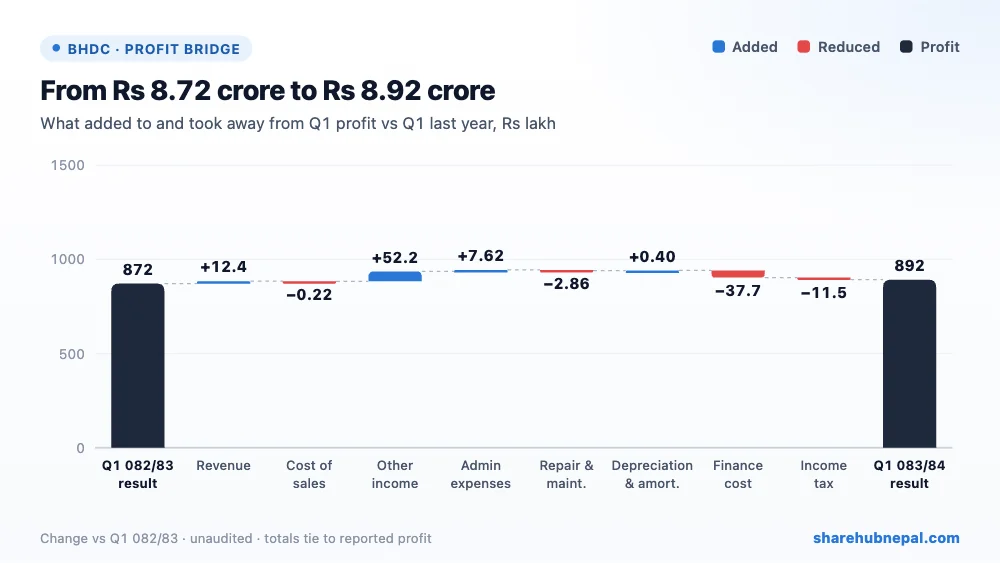
Compared with last year's Q1, other income added Rs 52.16 lakh, higher revenue Rs 12.43 lakh and lower administrative expenses Rs 7.62 lakh. Higher finance cost took away Rs 37.67 lakh, income tax Rs 11.50 lakh and higher repair and maintenance Rs 2.86 lakh.
2. Profit through the year
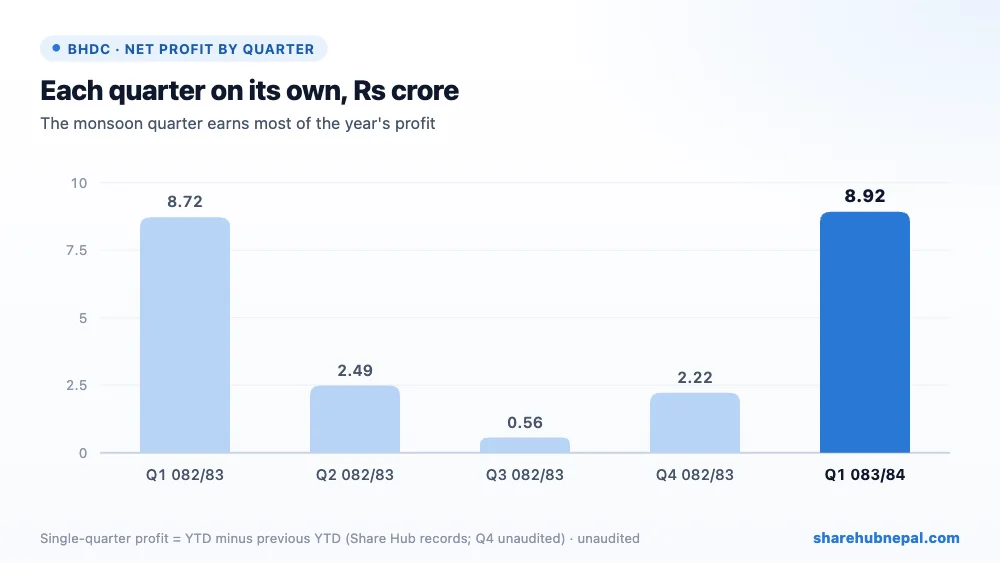
Based on Share Hub's records, single-quarter profit in 2082/83 was Rs 8.72 crore in Q1, Rs 2.49 crore in Q2, Rs 56.10 lakh in Q3 and Rs 2.22 crore in Q4 (unaudited full year Rs 13.98 crore; the audited figure is Rs 13.90 crore). The monsoon quarter earns about 60% of the year's profit, so the annualised EPS of Rs 30.08 is far above what the full year is likely to show.
3. Debt and balance sheet
| Particulars | Ashwin 2083 | Ashad 2083 | Change |
| Borrowings (non-current + current) | Rs 1,734,730,217 | Rs 1,764,188,441 | −1.67% |
| Project (intangible) assets | Rs 2,345,761,436 | Rs 2,371,901,663 | −1.10% |
| Other investments | Rs 292,248,667 | Rs 292,065,312 | +0.06% |
| Trade receivables | Rs 118,791,815 | Rs 84,786,449 | +40.11% |
| Other current assets | Rs 467,325,332 | Rs 414,671,959 | +12.70% |
| Cash and cash equivalents | Rs 10,126,129 | Rs 15,361,625 | −34.08% |
| Total assets | Rs 3,242,513,429 | Rs 3,187,824,253 | +1.72% |
| Total equity | Rs 1,487,170,227 | Rs 1,397,767,897 | +6.40% |
Total debt fell slightly to Rs 173.47 crore from Rs 176.42 crore at Ashad end, about 1.17 times equity. Receivables from NEA rose to Rs 11.88 crore and other current assets to Rs 46.73 crore, while cash fell to Rs 1.01 crore. The company holds Rs 29.22 crore of investments in other hydro projects (People's Energy, Multi Energy Development, Balefi Energy) and Nepal Power Exchange. Equity rose by the quarter's profit to Rs 148.72 crore, and net worth per share to Rs 125.36.
4. Per-share figures and valuation
| Indicator | Value |
| EPS (quarter, as reported) | Rs 7.52 |
| EPS (annualised) | Rs 30.08 |
| Net worth per share | Rs 125.36 |
| Market price (report) | Rs 442 |
| P/E (annualised EPS) | 14.69x |
| P/B | 3.53x |
| Liquidity ratio | 3.79 |
At Rs 442 the share trades at 14.69 times annualised EPS and 3.53 times net worth per share. On last year's audited EPS of Rs 11.71 the P/E is about 37.7, which is the better guide given how seasonal the profit is.
Conclusion
Positives: stable revenue in the peak season, profit up 2.34%, debt slightly lower, net worth up to Rs 125.36, and strong liquidity (3.79).
Watch: finance cost up 11.66%, reliance on unexplained other income, a large and growing other current assets balance, low cash, flat revenue, and a seasonal Q1 that overstates the annual EPS.
Bindhyabasini delivered a steady monsoon quarter. With revenue flat and interest rising, the dry-season quarters and the return on its investments in other projects will decide the full-year result.
Figures are from the company's unaudited Q1 report; quarter trends use Share Hub records. This is not investment advice.

