













Crest Micro Life Insurance Limited – First Quarter Analysis, FY 2083/84
Unaudited results as on Ashwin end 2083, compared with the same quarter last year (Ashwin end 2082) and with Ashad end 2083.
Summary
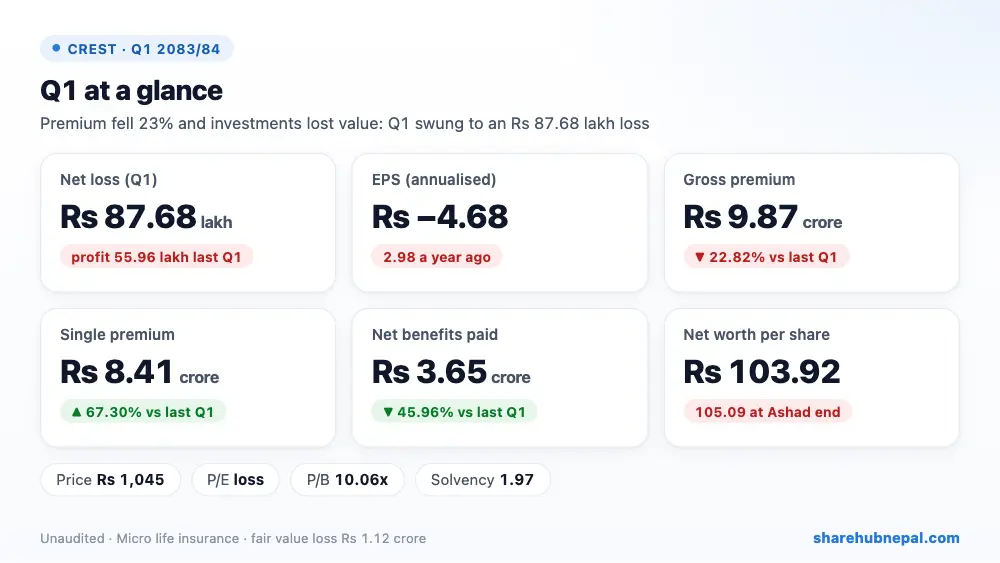
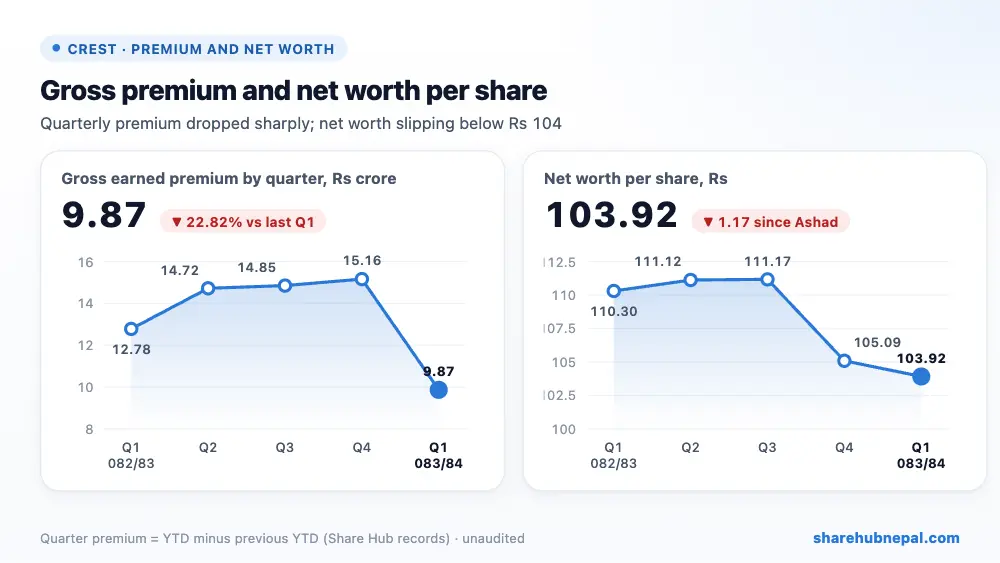
Crest Micro Life Insurance posted a net loss of Rs 87.68 lakh in the first quarter of 2083/84, against a profit of Rs 55.96 lakh a year ago. Annualised EPS is Rs −4.68 (Rs 2.98 last year) and net worth per share slipped to Rs 103.92 from Rs 105.09 at Ashad end. Equity fell by exactly the amount of the loss.
Two things hurt. First, business shrank: gross earned premium fell 22.82% to Rs 9.87 crore because regular first-year premium almost disappeared (first-year premium including single fell 27.67% to Rs 8.87 crore, even though single premium rose 67.30%). Second, investments lost money: a fair value loss of Rs 1.12 crore against Rs 1.67 crore of fair value and realised gains last year, and interest income fell 43.22%. Lower benefit payouts and much lower other operating costs softened the blow but could not cover it.
| Indicator | Q1 2083/84 | Q1 2082/83 | Change |
| Gross earned premium | Rs 98,659,714 | Rs 127,833,064 | −22.82% |
| Net earned premium | Rs 70,621,153 | Rs 98,312,395 | −28.17% |
| Investment income | Rs 7,660,527 | Rs 13,492,289 | −43.22% |
| Fair value and realised gains | −Rs 11,212,452 | Rs 16,743,173 | Turned to loss |
| Net benefits and claims paid | Rs 36,492,834 | Rs 67,523,214 | −45.96% |
| Commission and service fees | Rs 9,676,306 | Rs 8,946,880 | +8.15% |
| Staff costs | Rs 16,680,694 | Rs 17,001,137 | −1.88% |
| Other operating expenses | Rs 10,651,835 | Rs 27,236,591 | −60.89% |
| Profit/(loss) before tax | −Rs 8,767,929 | Rs 5,595,853 | Turned to loss |
| Net profit/(loss) | −Rs 8,767,929 | Rs 5,595,853 | Turned to loss |
| EPS (annualised) | -4.68 | 2.98 | – |
1. Where the profit came from
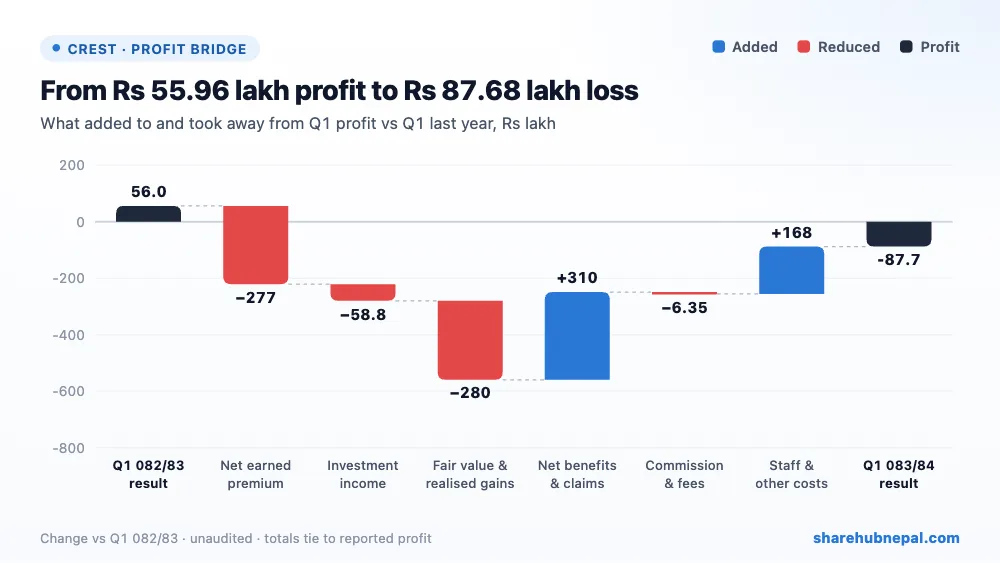
Compared with last year's Q1, lower net earned premium took away Rs 2.77 crore, lower investment income Rs 58.79 lakh, and the swing from investment gains to a fair value loss Rs 2.80 crore; higher commission and fees took Rs 6.35 lakh. On the other side, lower net benefits and claims added Rs 3.10 crore and lower staff and other operating costs Rs 1.68 crore. The net result is Rs 1.44 crore worse — from a profit of Rs 55.96 lakh to a loss of Rs 87.68 lakh.
2. Profit through the year
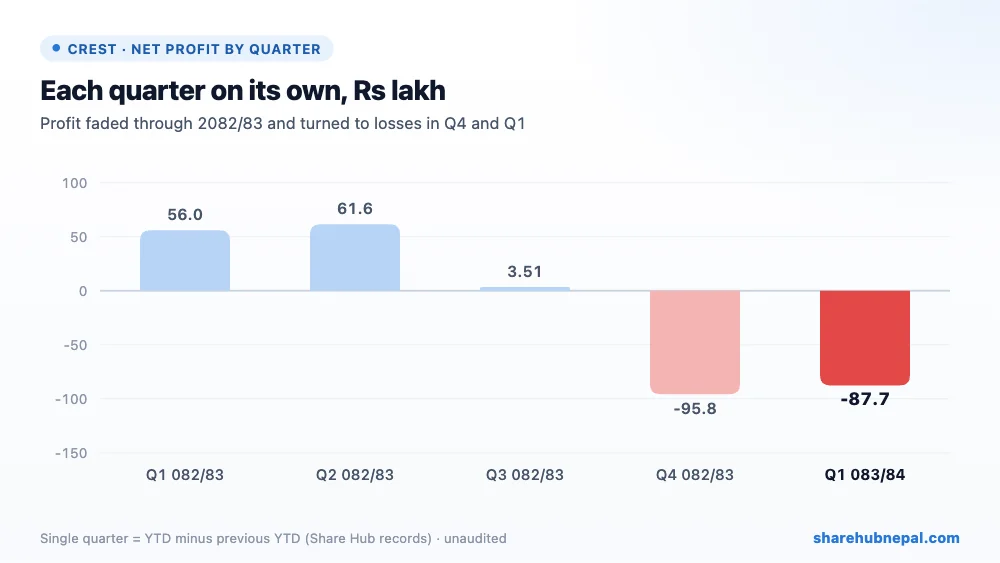
Based on Share Hub's records, single-quarter results in 2082/83 were a profit of Rs 55.96 lakh in Q1, Rs 61.55 lakh in Q2, Rs 3.51 lakh in Q3 and a loss of Rs 95.76 lakh in Q4 (full-year profit only Rs 25.26 lakh, after a tax credit). So this is the second loss-making quarter in a row. Premium had grown every quarter last year, so the 22.82% fall in Q1 is a clear break in the trend.
3. Debt and balance sheet
| Particulars | Ashwin 2083 | Ashad 2083 | Change |
| Investments | Rs 598,981,177 | Rs 695,193,629 | −13.84% |
| Cash and cash equivalents | Rs 453,670,641 | Rs 360,244,644 | +25.93% |
| Insurance receivables | Rs 37,495,781 | Rs 55,784,344 | −32.78% |
| Gross insurance contract liabilities | Rs 392,881,250 | Rs 387,118,081 | +1.49% |
| Retained earnings | −Rs 35,952,971 | −Rs 27,185,041 | −32.25% |
| Total equity | Rs 779,396,516 | Rs 788,164,445 | −1.11% |
| Total assets | Rs 1,199,015,213 | Rs 1,224,711,833 | −2.10% |
Total assets are Rs 1.20 arba. The company moved money out of investments (down to Rs 59.90 crore from Rs 69.52 crore) and into cash and bank balances (up to Rs 45.37 crore from Rs 36.02 crore). Insurance contract liabilities are Rs 39.29 crore; within this the life fund grew to Rs 22.39 crore from Rs 7.70 crore a year ago. Equity is Rs 77.94 crore on Rs 75 crore paid-up capital, and accumulated losses in retained earnings have grown to Rs 3.60 crore. There are no borrowings.
4. Per-share figures and valuation
| Indicator | Value |
| EPS (annualised) | Rs -4.68 |
| Net worth per share | Rs 103.92 |
| Total assets per share | Rs 159.87 |
| Market price (Q1 close) | Rs 1,045 |
| P/E | n/a (loss) |
| P/B | 10.06x |
| Solvency ratio (FY 2081/82) | 1.97 |
The Q1 closing price was Rs 1,045 (range Rs 1,017 to Rs 1,338). With a loss, P/E is not meaningful (the report prints −223.29); the price is 10.06 times net worth per share, which is very high for a company that is losing money. The solvency ratio is 1.97 (FY 2081/82 valuation). The report also says the CEO and former board officials remain suspended while legal proceedings are pending.
Conclusion
Positives: single premium up 67%, renewal premium nearly doubled, lower benefit payouts, other operating costs down 61%, more cash in the bank, a growing life fund and no borrowings.
Watch: the second loss quarter in a row, gross premium down 23%, policies issued down to 65,966 from 468,593, a fair value loss on investments, falling interest income, accumulated losses of Rs 3.60 crore, management still suspended pending legal proceedings, and a price at 10 times book value.
A weak quarter: less premium, investment losses and a second loss in a row. Lower costs helped, but the company needs premium growth and steadier investment income to get back to profit.
Figures are from the company's unaudited Q1 report; quarter trends use Share Hub records. This is not investment advice.

