













Everest Colour Limited – First Quarter Analysis, FY 2083/84
Unaudited results as on Ashwin end 2083, compared with the same quarter last year (Ashwin end 2082) and with Ashad end 2083.
Summary
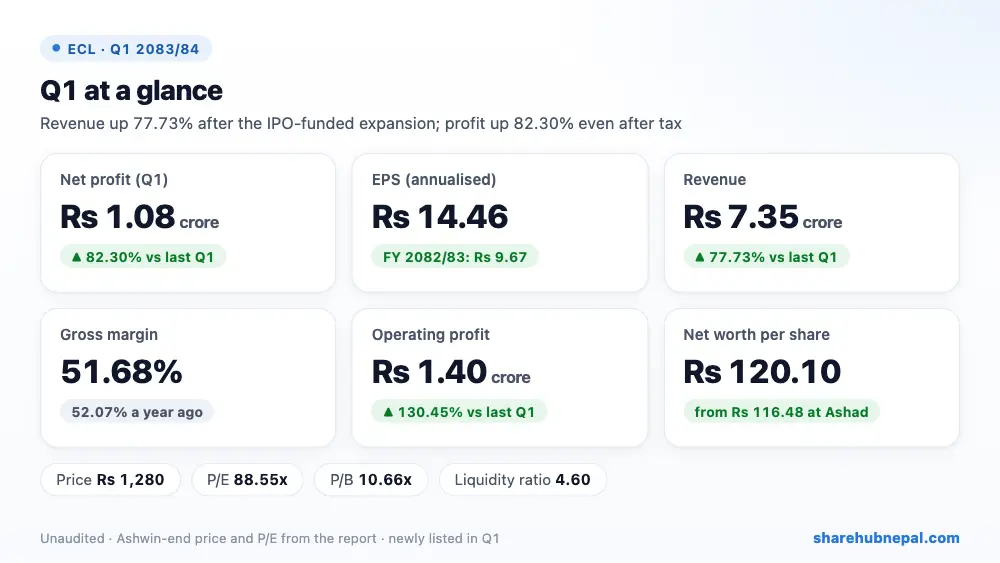
Everest Colour, the paint maker with a factory in Khairahani, Chitwan, earned a net profit of Rs 1.08 crore in the first quarter of FY 2083/84, its first quarter as a listed company. That is 82.30% more than the Rs 59.47 lakh of a year ago, even though it paid Rs 27.93 lakh in tax this time (none last year). Annualised EPS is Rs 14.46, against Rs 9.67 for the whole of FY 2082/83.
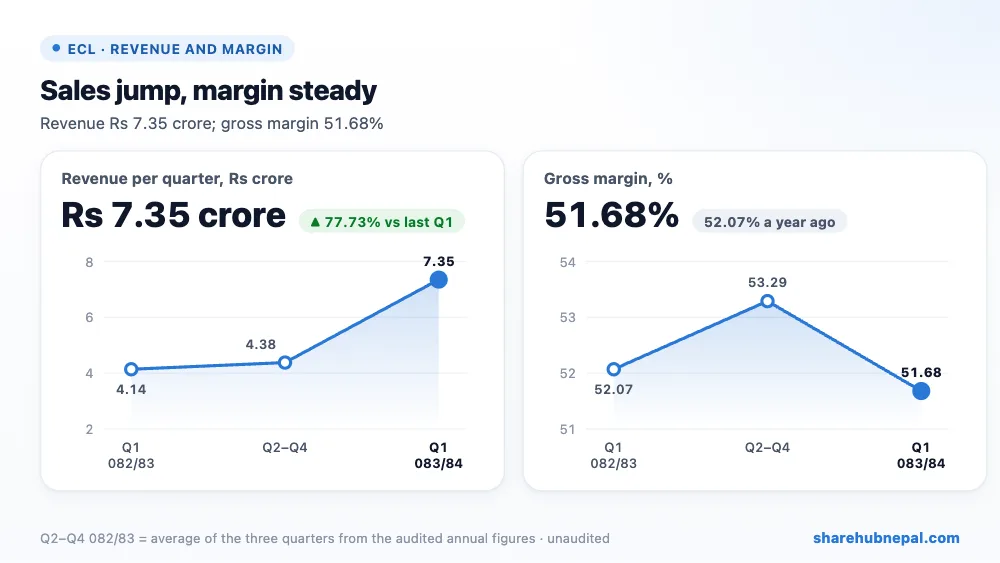
Revenue jumped 77.73% to Rs 7.35 crore. Cost of goods sold rose a little faster (79.21%), so the gross margin was almost unchanged at 51.68% (52.07% last year), and gross profit rose 76.37% to Rs 3.80 crore. Staff (+53.52%), admin (+91.86%) and selling costs (+44.30%) grew more slowly than sales overall, so profit from operations rose 130.45% to Rs 1.40 crore. The company says it has added modern machines to raise factory capacity and is expanding its dealer network.
| Indicator | Q1 2083/84 | Q1 2082/83 | Change |
| Revenue from operations | Rs 73,524,167 | Rs 41,368,309 | +77.73% |
| Cost of goods sold | Rs 35,530,273 | Rs 19,826,226 | +79.21% |
| Gross profit | Rs 37,993,894 | Rs 21,542,082 | +76.37% |
| Employee expenses | Rs 4,472,285 | Rs 2,913,256 | +53.52% |
| Administrative expenses | Rs 5,671,913 | Rs 2,956,334 | +91.86% |
| Selling and distribution | Rs 12,430,136 | Rs 8,613,991 | +44.30% |
| Depreciation and amortisation | Rs 1,458,355 | Rs 1,018,190 | +43.23% |
| Profit from operations | Rs 13,985,862 | Rs 6,068,875 | +130.45% |
| Finance cost | Rs 242,331 | Rs 122,084 | +98.50% |
| Income tax | Rs 2,792,767 | Rs 0 | – |
| Net profit (after CSR) | Rs 10,841,256 | Rs 5,946,791 | +82.30% |
| EPS (quarter) | 3.61 | 2.69 | – |
1. Where the profit came from
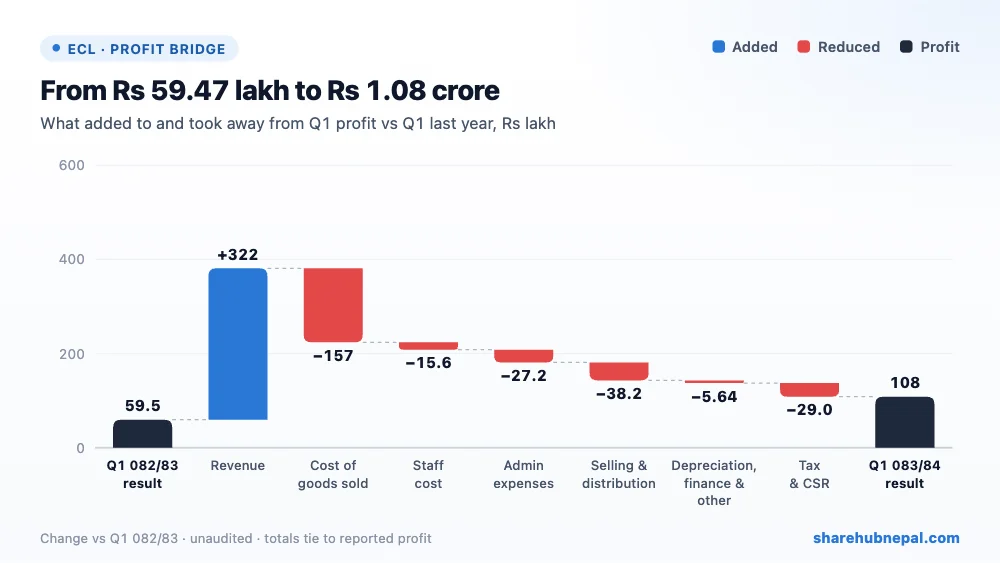
Compared with last year's Q1, higher revenue added Rs 3.22 crore and higher cost of goods sold took away Rs 1.57 crore. Selling and distribution cost took away Rs 38.16 lakh, admin cost Rs 27.16 lakh and staff cost Rs 15.59 lakh; depreciation, finance cost and slightly lower other income together took Rs 5.64 lakh. Tax and the CSR appropriation took Rs 29.02 lakh, as no tax was charged last year. Net result: Rs 48.94 lakh more profit.
2. Profit through the year
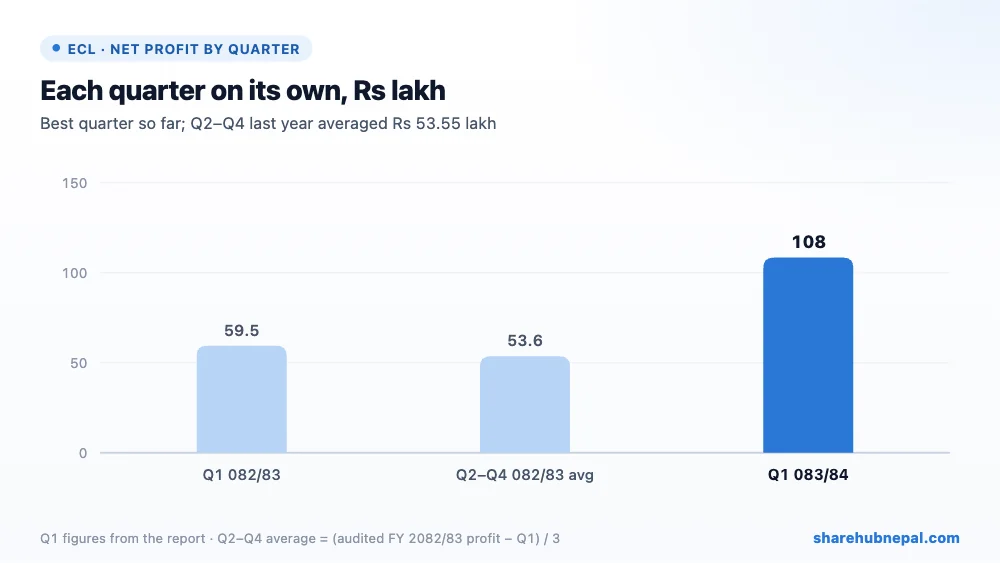
Share Hub has no Q2 or Q3 2082/83 records for Everest Colour (it listed only recently). The audited FY 2082/83 profit was Rs 2.20 crore; taking out last year's Q1 (Rs 59.47 lakh), the other three quarters averaged about Rs 53.55 lakh each. This Q1, at Rs 1.08 crore, is about double that average and the best quarter on record.
3. Debt and balance sheet
| Particulars | Ashwin 2083 | Ashad 2083 | Change |
| Property, plant and equipment | Rs 135,855,892 | Rs 128,225,048 | +5.95% |
| Inventories | Rs 50,263,419 | Rs 49,347,544 | +1.86% |
| Trade and other receivables | Rs 172,855,964 | Rs 140,138,091 | +23.35% |
| Cash and cash equivalents | Rs 66,222,483 | Rs 84,555,311 | −21.68% |
| Loans (long + short term) | Rs 18,738,543 | Rs 17,462,619 | +7.31% |
| Current liabilities | Rs 65,812,130 | Rs 53,459,025 | +23.11% |
| Total equity | Rs 360,287,125 | Rs 349,445,869 | +3.10% |
The IPO raised the capital to Rs 30 crore, and the money is being spent as planned in the prospectus: machinery, delivery trucks, office equipment and vehicles, with land being bought for the head office and a Biratnagar branch. Cash fell 21.68% to Rs 6.62 crore as this spending continued, and property, plant and equipment rose by Rs 76.31 lakh. Trade receivables rose 23.35% to Rs 17.29 crore — more than two quarters of sales — so collecting from dealers is the main thing to watch. Loans are small at Rs 1.87 crore, and current assets are 4.60 times current liabilities. Equity rose exactly by the Q1 profit to Rs 36.03 crore.
4. Per-share figures and valuation
| Indicator | Value |
| EPS (quarter, report) | Rs 3.61 |
| EPS (annualised, report) | Rs 14.46 |
| Net worth per share | Rs 120.10 |
| Total assets per share | Rs 146.27 |
| Market price (Ashwin end) | Rs 1,280 |
| P/E (report) | 88.55x |
| P/B | 10.66x |
| Liquidity ratio | 4.60 |
The share traded between Rs 296.60 and Rs 1,980 in its first quarter on the market and closed at Rs 1,280. That is 88.55 times annualised EPS and 10.66 times net worth per share; on the audited FY 2082/83 EPS of Rs 9.67 the P/E is about 132. These are very high multiples for a small paint company, so the price assumes fast growth for years.
Conclusion
Positives: revenue up 77.73%, profit up 82.30% even after paying tax, steady gross margin above 50%, low debt, good liquidity (4.60), new machines and a growing dealer network.
Watch: receivables of Rs 17.29 crore, admin cost up 91.86%, raw material prices and the exchange rate (the company's own main challenges), strong competition from local and foreign paint brands, inflation and transport costs, and a very high P/E and P/B.
A strong first quarter as a listed company, with growth coming from real sales. Watch whether dealers pay on time, whether margins hold as raw material prices move, and how quickly the new capacity turns into more sales.
Figures are from the company's unaudited Q1 report; quarter trends use Share Hub records. This is not investment advice.

