













Himalayan Life Insurance Limited – First Quarter Analysis, FY 2083/84
Unaudited results as on Ashwin end 2083, compared with the same quarter last year (Ashwin end 2082) and with Ashad end 2083.
Summary
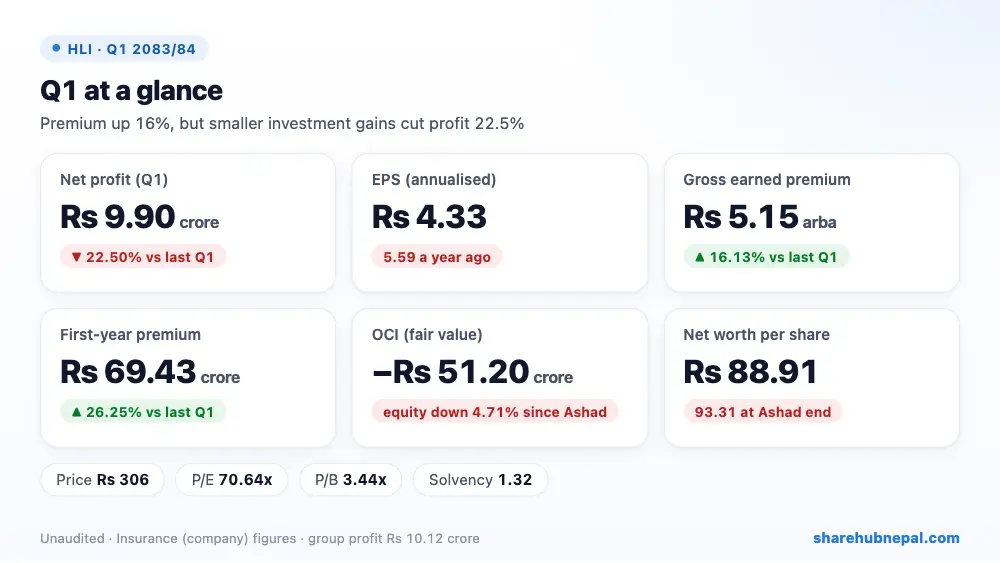
Himalayan Life Insurance earned a net profit of Rs 9.90 crore in the first quarter of 2083/84, down 22.50% from Rs 12.78 crore a year ago. Annualised EPS is Rs 4.33 (Rs 5.59 last year). The group, including its subsidiary and associate, earned Rs 10.12 crore (group EPS Rs 4.43). Net worth per share fell to Rs 88.91 from Rs 93.31 at Ashad end because of a fair value loss of Rs 51.20 crore on investments, booked in other comprehensive income.
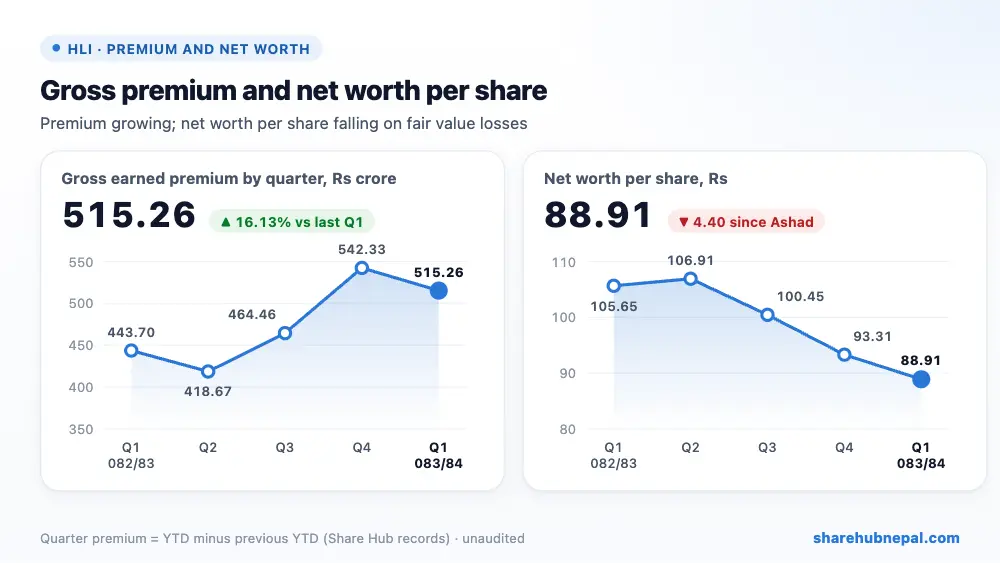
The insurance business grew: gross earned premium rose 16.13% to Rs 5.15 arba, with first-year premium up 26.25% to Rs 69.43 crore (single premium more than doubled) and renewal premium up 14.69%. Most of the extra premium went into benefits and policy reserves (up 11.94% to Rs 5.68 arba). The profit fell because realised gains on selling investments dropped to Rs 49.71 lakh from Rs 13.16 crore, and investment income fell 8.87%. Lower staff costs (down 29.15%) and a much smaller tax bill softened the fall.
| Indicator | Q1 2083/84 | Q1 2082/83 | Change |
| Gross earned premium | Rs 5,152,562,734 | Rs 4,437,049,662 | +16.13% |
| Net earned premium | Rs 5,036,164,708 | Rs 4,325,934,379 | +16.42% |
| Investment income and policy-loan interest | Rs 1,443,607,975 | Rs 1,537,548,344 | −6.11% |
| Realised gains on investments | Rs 4,971,091 | Rs 131,602,368 | −96.22% |
| Net benefits, claims and change in reserves | Rs 5,677,729,725 | Rs 5,071,925,282 | +11.94% |
| Commission and service fees | Rs 441,870,869 | Rs 384,699,852 | +14.86% |
| Staff and other operating expenses | Rs 295,384,993 | Rs 382,428,982 | −22.76% |
| Profit before tax | Rs 105,930,107 | Rs 185,026,746 | −42.75% |
| Income tax | Rs 6,913,991 | Rs 57,267,218 | −87.93% |
| Net profit | Rs 99,016,115 | Rs 127,759,529 | −22.50% |
| Other comprehensive income | −Rs 512,045,761 | −Rs 551,446,212 | +7.14% |
| EPS (annualised) | 4.33 | 5.59 | – |
1. Where the profit came from
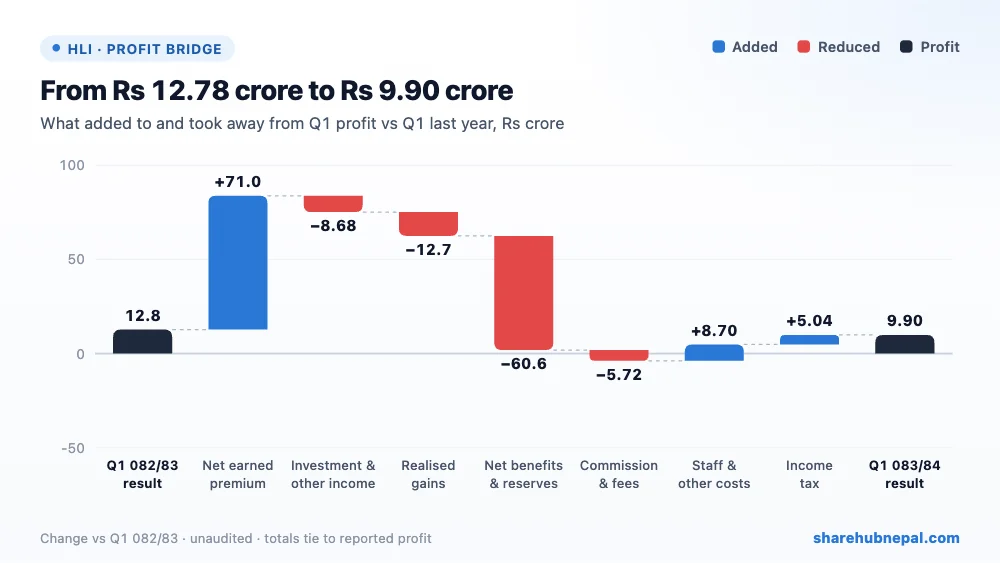
Compared with last year's Q1, higher net earned premium added Rs 71.02 crore, lower staff and other operating costs Rs 8.70 crore and lower tax Rs 5.04 crore. Against that, higher net benefits and reserves took away Rs 60.58 crore, lower investment and other income Rs 8.68 crore, much smaller realised gains Rs 12.66 crore and higher commission and fees Rs 5.72 crore. The net result is Rs 2.87 crore less profit.
2. Profit through the year
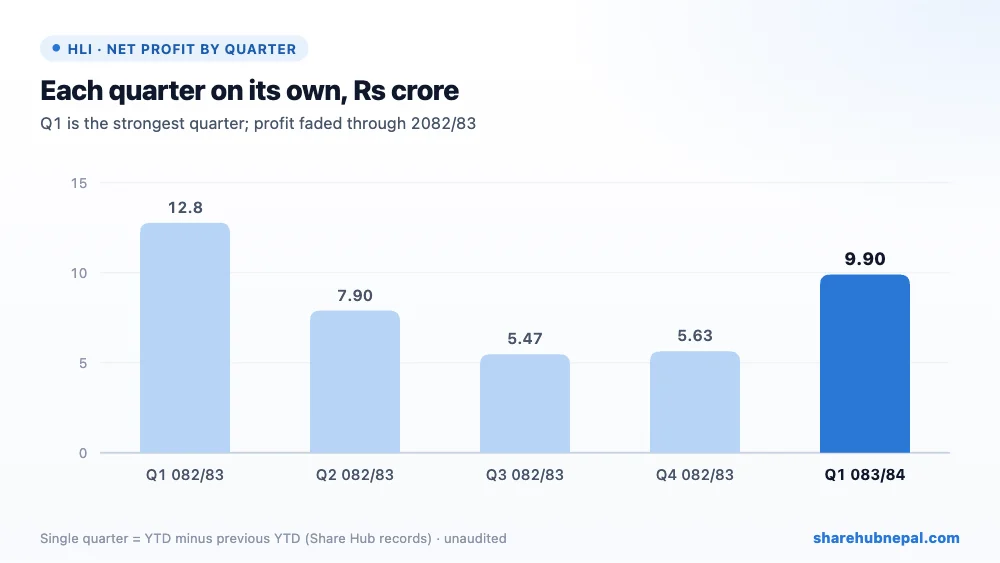
Based on Share Hub's records, single-quarter profit in 2082/83 was Rs 12.78 crore in Q1, Rs 7.90 crore in Q2, Rs 5.47 crore in Q3 and Rs 5.63 crore in Q4 (full year Rs 31.78 crore). This Q1 is better than any of the last three quarters but below last year's Q1. The annualised EPS of Rs 4.33 assumes every quarter matches Q1, which did not happen last year.
3. Debt and balance sheet
| Particulars | Ashwin 2083 | Ashad 2083 | Change |
| Investments | Rs 83,916,643,931 | Rs 82,880,739,837 | +1.25% |
| Policyholder and other loans | Rs 8,792,010,369 | Rs 8,608,329,609 | +2.13% |
| Cash and cash equivalents | Rs 7,001,076,285 | Rs 5,644,347,856 | +24.04% |
| Gross insurance contract liabilities | Rs 93,473,958,583 | Rs 89,566,246,310 | +4.36% |
| Other equity (fair value reserve etc.) | −Rs 2,625,545,634 | −Rs 2,130,784,473 | −23.22% |
| Total equity | Rs 8,129,699,061 | Rs 8,531,136,302 | −4.71% |
| Total assets | Rs 105,747,484,311 | Rs 102,936,049,153 | +2.73% |
Total assets are Rs 105.75 arba, almost all backing policyholder liabilities of Rs 93.47 arba; the life fund grew 16.11% in a year to Rs 93.25 arba. Investments are Rs 83.92 arba. The mix moved shorter: long-term investments fell to Rs 52.42 arba from Rs 61.30 arba a year ago while short-term investments rose to Rs 32.49 arba from Rs 17.73 arba, and cash rose to Rs 7.00 arba. Policyholder loans are Rs 8.72 arba. Equity fell to Rs 8.13 arba (paid-up capital Rs 9.14 arba) because the fair value reserve in other equity deepened to −Rs 2.63 arba; equity is now below paid-up capital. Equity fell Rs 1.16 crore less than the total comprehensive loss, which the report does not explain.
4. Per-share figures and valuation
| Indicator | Value |
| EPS (annualised) | Rs 4.33 |
| Group EPS (annualised) | Rs 4.43 |
| Net worth per share | Rs 88.91 |
| Total assets per share | Rs 1,156.57 |
| Market price (Q1 close) | Rs 306 |
| P/E | 70.64x |
| P/B | 3.44x |
| Solvency ratio (FY 2081/82) | 1.32 (3.86 a year earlier) |
The Q1 closing price was Rs 306 (range Rs 284.30 to Rs 344.40). That is 70.64 times annualised EPS and 3.44 times net worth per share. The solvency ratio for FY 2081/82 is 1.32, sharply down from 3.86 a year earlier — still above 1, but much thinner. The management expense ratio improved to 5.73% of total premium from 8.62%, and the report says there are no legal cases.
Conclusion
Positives: premium growth of 16% (first-year +26%, single more than doubled), a growing life fund, staff costs down 29%, a better management expense ratio, more cash and short-term deposits, and no legal cases.
Watch: profit down 22.5% as realised gains dried up, investment income down 9%, a Rs 51.20 crore fair value loss in OCI that pushed equity below paid-up capital, solvency down to 1.32 from 3.86, a P/E above 70, and the small unexplained gap in equity.
The business is growing, but this quarter's profit leaned on investments that gave less than last year, and fair value losses keep eating into net worth. The thin solvency ratio is the main thing to watch.
Figures are from the company's unaudited Q1 report; quarter trends use Share Hub records. This is not investment advice.

