













Himalayan Reinsurance Limited – First Quarter Analysis, FY 2083/84
Unaudited results as on Ashwin end 2083, compared with the same quarter last year (Ashwin end 2082) and with Ashad end 2083.
Summary
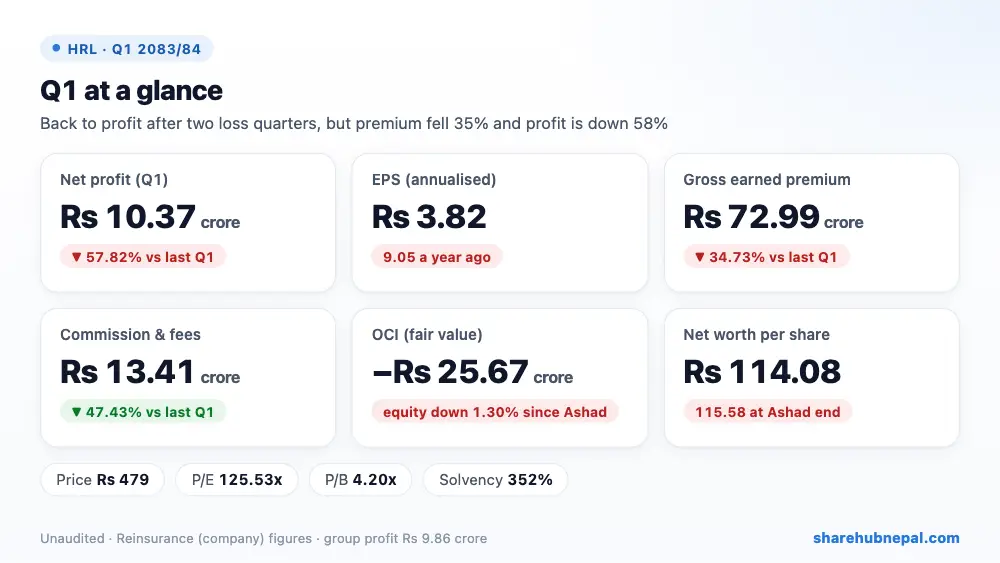
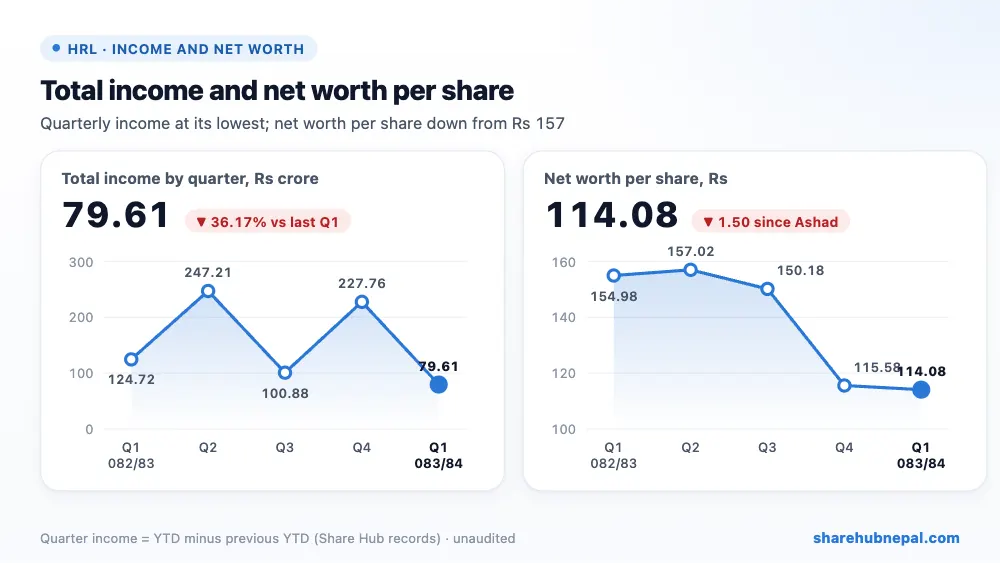
Himalayan Reinsurance earned a net profit of Rs 10.37 crore in the first quarter of 2083/84, down 57.82% from Rs 24.58 crore a year ago, but a welcome return to profit after big losses in the last two quarters of 2082/83. Annualised EPS is Rs 3.82 (Rs 9.05 last year). Net worth per share slipped to Rs 114.08 from Rs 115.58 at Ashad end, mainly because of a Rs 25.67 crore fair value loss on investments in other comprehensive income.
Business shrank: gross earned premium fell 34.73% to Rs 72.99 crore and, with more ceded to retrocessionaires, net earned premium fell 41.62% to Rs 59.02 crore. Investment income fell 12.10%. What saved the quarter was cost: net claims fell 10.22%, commission and fees fell 47.43%, and staff and other operating costs fell 55.85%. The company says it is consolidating domestic business and trying to grow abroad.
| Indicator | Q1 2083/84 | Q1 2082/83 | Change |
| Gross earned premium | Rs 729,928,347 | Rs 1,118,347,117 | −34.73% |
| Net earned premium | Rs 590,197,144 | Rs 1,011,009,549 | −41.62% |
| Investment income | Rs 205,634,435 | Rs 233,933,445 | −12.10% |
| Net claims incurred | Rs 457,561,434 | Rs 509,619,874 | −10.22% |
| Commission, fees and other direct | Rs 134,058,856 | Rs 255,013,528 | −47.43% |
| Staff and other operating costs | Rs 64,341,343 | Rs 145,720,480 | −55.85% |
| Profit before tax | Rs 140,107,612 | Rs 336,893,554 | −58.41% |
| Income tax | Rs 36,429,493 | Rs 91,078,577 | −60.00% |
| Net profit | Rs 103,678,119 | Rs 245,814,977 | −57.82% |
| Other comprehensive income | −Rs 256,739,312 | −Rs 367,311,202 | +30.10% |
| EPS (annualised) | 3.82 | 9.05 | – |
1. Where the profit came from
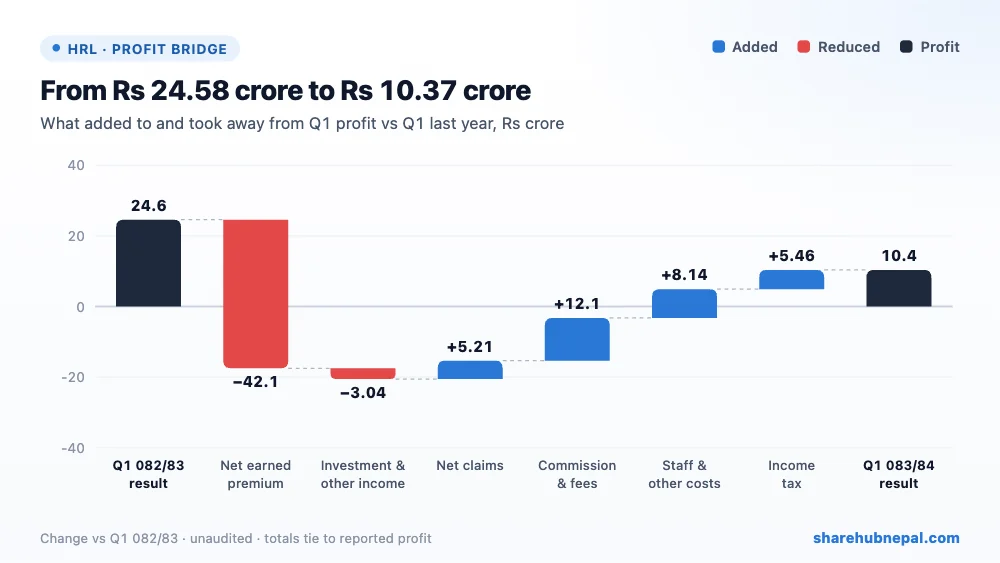
Compared with last year's Q1, lower net earned premium took away Rs 42.08 crore and lower investment and other income Rs 3.04 crore. On the other side, lower net claims added Rs 5.21 crore, lower commission and fees Rs 12.10 crore, lower staff and other operating costs Rs 8.14 crore and lower tax Rs 5.46 crore. The net result is Rs 14.21 crore less profit.
2. Profit through the year
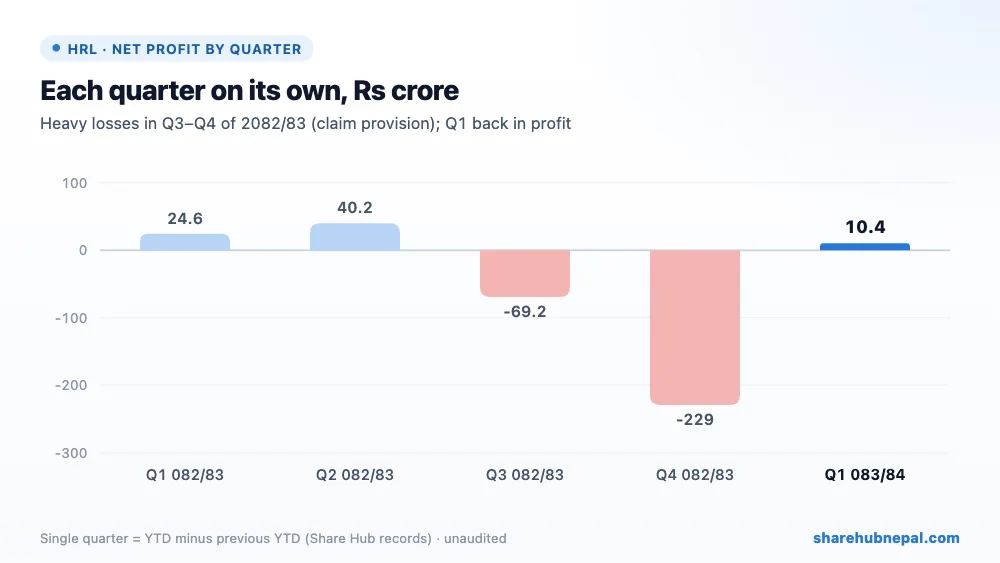
Based on Share Hub's records, single-quarter results in 2082/83 were a profit of Rs 24.58 crore in Q1 and Rs 40.17 crore in Q2, then losses of Rs 69.18 crore in Q3 and Rs 2.29 arba in Q4 (full-year loss Rs 2.34 arba, mostly from a large claim provision of about Rs 4.03 arba made on the regulator's instruction). So this Q1 profit is small, but it ends the loss run.
3. Debt and balance sheet
| Particulars | Ashwin 2083 | Ashad 2083 | Change |
| Investments | Rs 15,373,201,916 | Rs 15,861,667,461 | −3.08% |
| Cash and cash equivalents | Rs 932,528,578 | Rs 739,905,011 | +26.03% |
| Insurance receivables | Rs 1,472,310,163 | Rs 1,486,441,986 | −0.95% |
| Gross insurance contract liabilities | Rs 8,641,013,805 | Rs 8,346,861,961 | +3.52% |
| Provisions (incl. claim provision) | Rs 4,025,222,421 | Rs 4,025,222,421 | +0.00% |
| Total equity | Rs 12,398,585,763 | Rs 12,561,646,955 | −1.30% |
| Total assets | Rs 25,896,413,459 | Rs 26,085,579,261 | −0.73% |
Total assets are Rs 25.90 arba. Investments are Rs 15.37 arba; long-term investments fell to Rs 11.47 arba from Rs 15.19 arba a year ago while short-term investments rose to Rs 5.06 arba. The Rs 4.03 arba claim provision made last year is still in the books; the report says it will be reversed through retained earnings if the liability is not established. Retained earnings show an accumulated loss of Rs 3.26 arba. Equity is Rs 12.40 arba on Rs 10.87 arba paid-up capital; it fell Rs 1 crore more than the total comprehensive loss, which the report does not explain. There are no borrowings.
4. Per-share figures and valuation
| Indicator | Value |
| EPS (annualised) | Rs 3.82 |
| Group EPS (annualised) | Rs 3.63 |
| Net worth per share | Rs 114.08 |
| Total assets per share | Rs 238.28 |
| Market price (Q1 close) | Rs 479 |
| P/E | 125.53x |
| P/B | 4.20x |
| Solvency ratio (FY 2080/81) | 352% |
The Q1 closing price was Rs 479 (range Rs 469 to Rs 677.20). That is 125.53 times annualised EPS and 4.20 times net worth per share. The latest reported solvency ratio is 352% (FY 2080/81). The company has filed a case against Bhrikuti Stock Broking to recover money from share-market transactions; there are no cases against the company.
Conclusion
Positives: a return to profit after two loss quarters, much lower commission, staff and other costs, lower net claims, more cash and short-term deposits, a strong reported solvency ratio and no borrowings.
Watch: premium down 35% and net premium down 42%, profit down 58% on last year's Q1, a Rs 25.67 crore OCI loss, the Rs 4.03 arba claim provision still unresolved, accumulated losses of Rs 3.26 arba, the unexplained Rs 1 crore equity gap, and a P/E above 125.
A small profit that ends the loss run, earned mainly by cutting costs while premium shrank. Growth in premium and a clear outcome on the large claim provision are what will matter next.
Figures are from the company's unaudited Q1 report; quarter trends use Share Hub records. This is not investment advice.

