













Kalika Power Company Ltd – First Quarter Analysis, FY 2083/84
Unaudited results as on Ashwin end 2083, compared with the same quarter last year (Ashwin end 2082) and with Ashad end 2083.
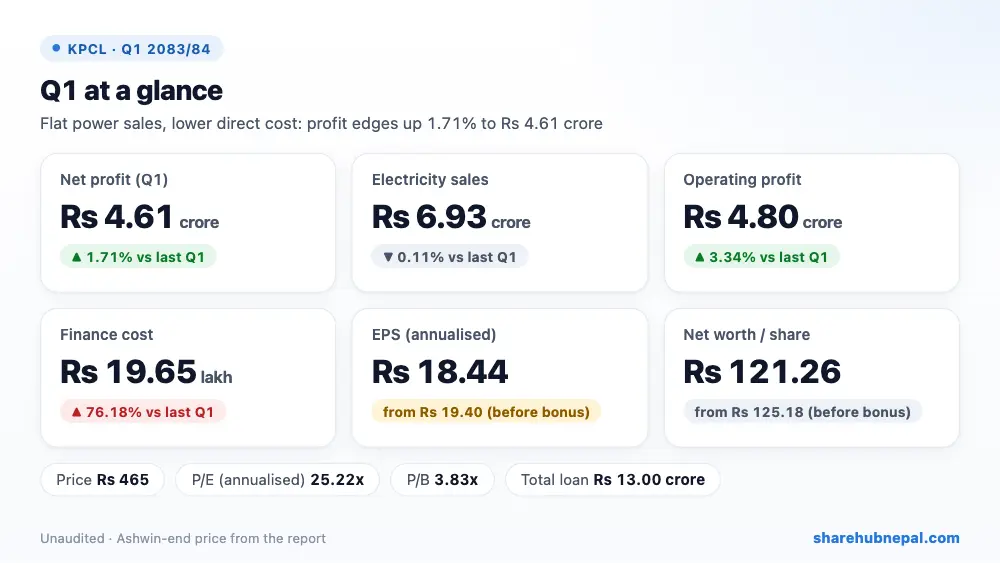
Summary
Kalika Power earned a net profit of Rs 4.61 crore in the first quarter of FY 2083/84, up 1.71% from Rs 4.53 crore a year ago. Power sales were flat at Rs 6.93 crore, so the small gain came from a 25.52% cut in direct cost, while finance cost rose 76.18% to Rs 19.65 lakh. The company issued 7% bonus shares, so annualised EPS is Rs 18.44 (Rs 19.40 last year on fewer shares) and net worth per share is Rs 121.26. Its balance sheet is strong: Rs 17.11 crore of cash against just Rs 13 crore of loans.
| Indicator | Q1 2083/84 | Q1 2082/83 | Change |
| Revenue from sales | Rs 69,285,979 | Rs 69,362,651 | −0.11% |
| Cost of sales | Rs 5,976,295 | Rs 8,023,661 | −25.52% |
| Other income | Rs 32,670 | Rs 324,170 | −89.92% |
| Operating profit | Rs 48,039,597 | Rs 46,488,616 | +3.34% |
| Finance cost | Rs 1,964,913 | Rs 1,115,285 | +76.18% |
| Income tax | Rs 8,168 | Rs 81,042 | −89.92% |
| Net profit | Rs 46,066,516 | Rs 45,292,288 | +1.71% |
| EPS (annualised) | 18.44 | 19.4 | – |
| Net worth per share | 121.26 | 118.33 | – |
1. Where the profit came from
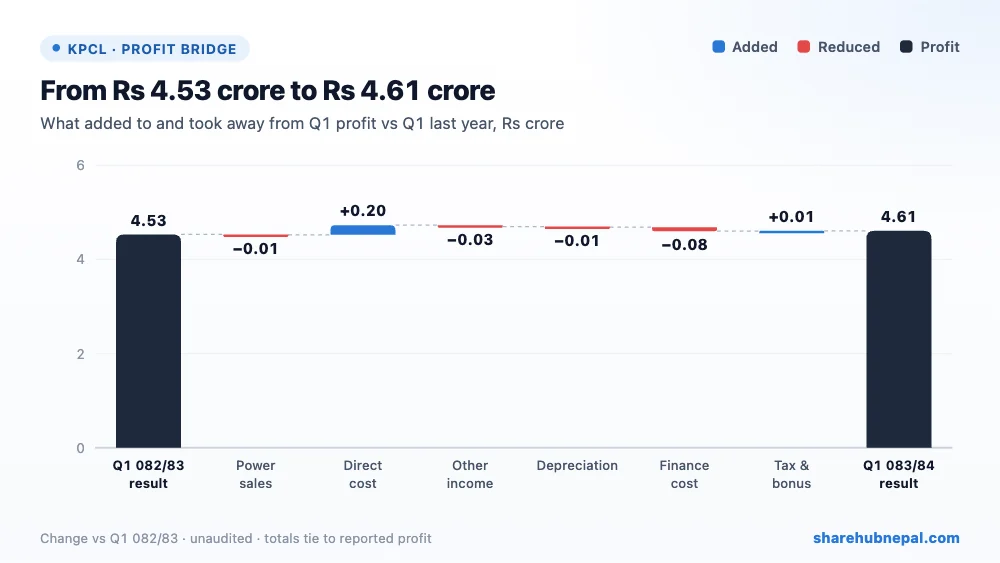
Power sales of Rs 6.93 crore were almost the same as last year. Direct cost fell to Rs 59.76 lakh from Rs 80.24 lakh, so gross profit rose to Rs 6.33 crore. Admin costs stayed at Rs 18.43 lakh and depreciation at Rs 1.35 crore, giving an operating profit of about Rs 4.80 crore (+3.34%). Finance cost rose to Rs 19.65 lakh because long-term loans are higher than a year ago. Tax was only Rs 8,168 and no bonus was provided, so net profit was Rs 4.61 crore.
2. Profit through the year
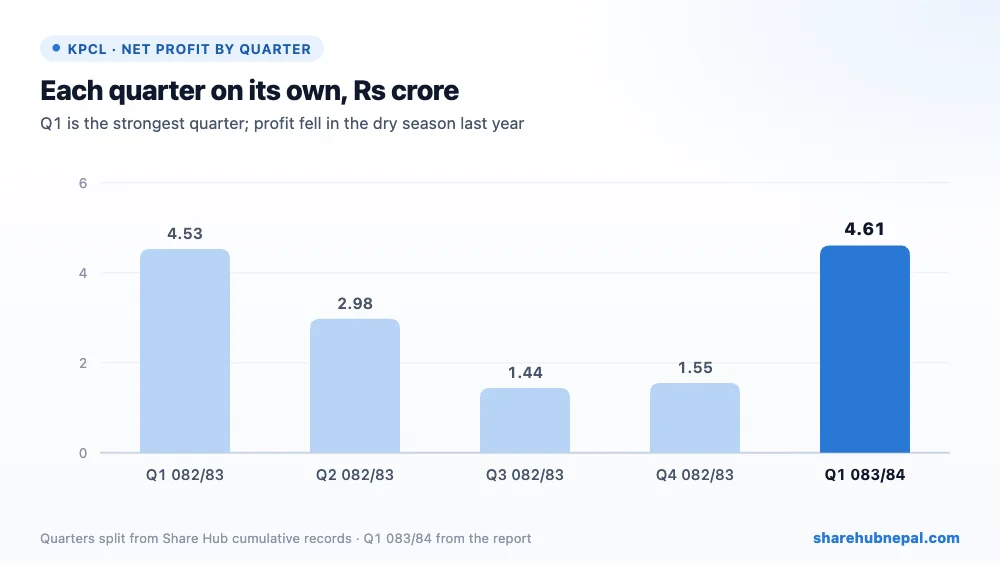
Profit by quarter (Share Hub cumulative records, split into quarters): Q1 082/83: Rs 4.53 crore, Q2 082/83: Rs 2.98 crore, Q3 082/83: Rs 1.44 crore, Q4 082/83: Rs 1.55 crore, Q1 083/84: Rs 4.61 crore. Profit falls through the year as river flow drops: last year Q1 earned Rs 4.53 crore but Q3 and Q4 only about Rs 1.5 crore each, and full-year EPS was Rs 11.24. So annualised EPS of Rs 18.44 overstates the full year.
3. Debt and balance sheet
| Particulars | Ashwin 2083 | Ashad 2083 | Change |
| Total assets | Rs 1,352,187,843 | Rs 1,311,554,698 | +3.10% |
| Total equity | Rs 1,211,742,499 | Rs 1,169,116,850 | +3.65% |
| Long-term borrowings | Rs 115,000,000 | Rs 115,000,000 | +0.00% |
| Short-term borrowings | Rs 15,000,000 | Rs 21,681,003 | −30.82% |
| Advances, deposits and margin | Rs 142,004,713 | Rs 142,060,984 | −0.04% |
| Trade receivables | Rs 46,284,812 | Rs 33,244,712 | +39.22% |
| Cash and equivalents | Rs 171,082,119 | Rs 128,860,141 | +32.77% |
| Current liabilities | Rs 25,445,344 | Rs 27,437,848 | −7.26% |
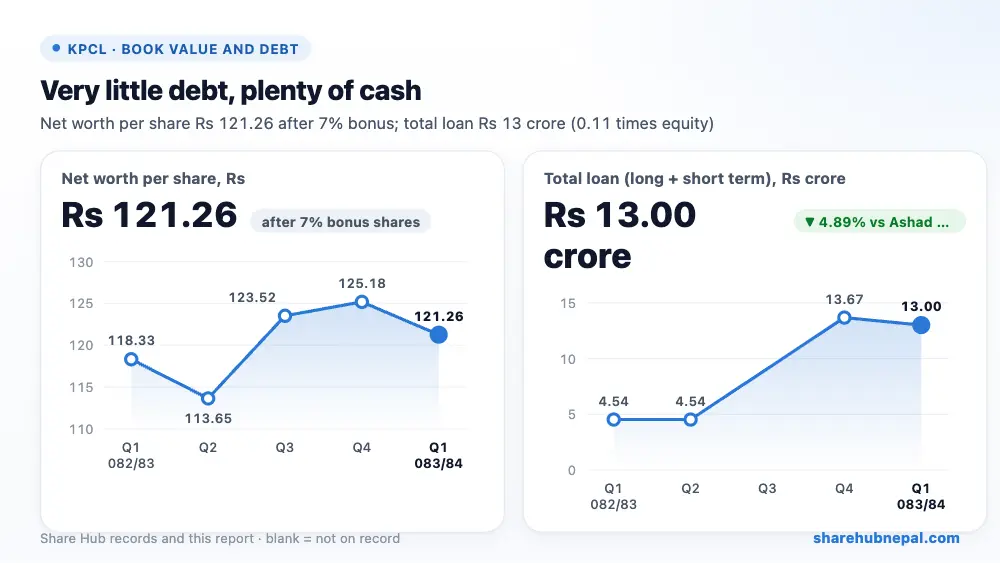
Kalika has very little debt: Rs 11.50 crore long-term and Rs 1.50 crore short-term, only 0.11 times equity. Cash rose 32.77% to Rs 17.11 crore, and the current ratio is about 12 as printed. Advances, deposits and margin of Rs 14.20 crore (Rs 29.28 lakh a year ago) and new investments of Rs 3.52 crore are worth watching, as the report does not say what they are for. Retained earnings fell because Rs 6.54 crore was turned into bonus shares.
4. Per-share figures and valuation
| Indicator | Value |
| EPS (annualised) | Rs 18.44 |
| Net worth per share | Rs 121.26 |
| Market price (Ashwin end) | Rs 465 |
| P/E (annualised) | 25.22x |
| P/B | 3.83x |
At the Ashwin-end price of Rs 465, the share trades at 25.22 times annualised EPS and 3.83 times net worth per share. On last year's actual EPS of Rs 11.24 (about Rs 10.5 on today's larger share count), the P/E would be over 40 times.
Conclusion
Positives: steady profit, very low debt, Rs 17.11 crore of cash, lower direct cost, a 7% bonus issue, and no legal cases.
Watch: sales did not grow, finance cost is up 76.18%, profit is seasonal, Rs 14.20 crore of advances and deposits are not explained, and the company lists hydrology, climate change and natural disasters as risks.
Watch dry-season profit, what the advances and new investments are for, and whether sales can grow beyond last year's level.
Figures are from the company's unaudited Q1 report; quarter trends use Share Hub records. This is not investment advice.

