













Ngadi Group Power Ltd. – First Quarter Analysis, FY 2083/84
Unaudited results as on Ashwin end 2083, compared with the same quarter last year (Ashwin end 2082) and with Ashad end 2083.
Summary
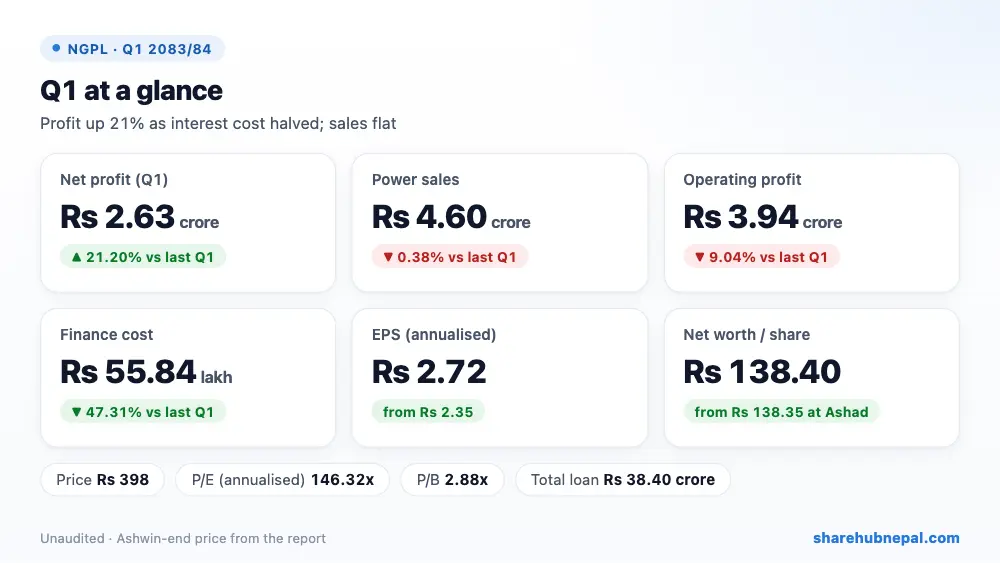
Ngadi Group Power earned Rs 2.63 crore in the first quarter of 2083/84, up 21.20% from Rs 2.17 crore a year ago. Power sales from the Siuri Khola project were flat at Rs 4.60 crore, so the gain came from costs: finance cost fell 47.31% to Rs 55.84 lakh and there was no current tax this quarter (Rs 31.03 lakh last year). Non-operating income dropped and admin cost rose. Annualised EPS is Rs 2.72 against Rs 2.35.
| Indicator | Q1 2083/84 | Q1 2082/83 | Change |
| Revenue from sales | Rs 46,048,648 | Rs 46,224,276 | −0.38% |
| Cost of sales | Rs 3,153,472 | Rs 3,289,669 | −4.14% |
| Other income | Rs 534,620 | Rs 2,847,098 | −81.22% |
| Operating profit | Rs 39,448,847 | Rs 43,369,995 | −9.04% |
| Finance cost | Rs 5,583,813 | Rs 10,597,234 | −47.31% |
| Income tax | Rs 0 | Rs 3,103,457 | −100.00% |
| Net profit | Rs 26,330,420 | Rs 21,724,202 | +21.20% |
| EPS (annualised) | 2.72 | 2.35 | – |
| Net worth per share | 138.4 | 155.64 | – |
1. Where the profit came from
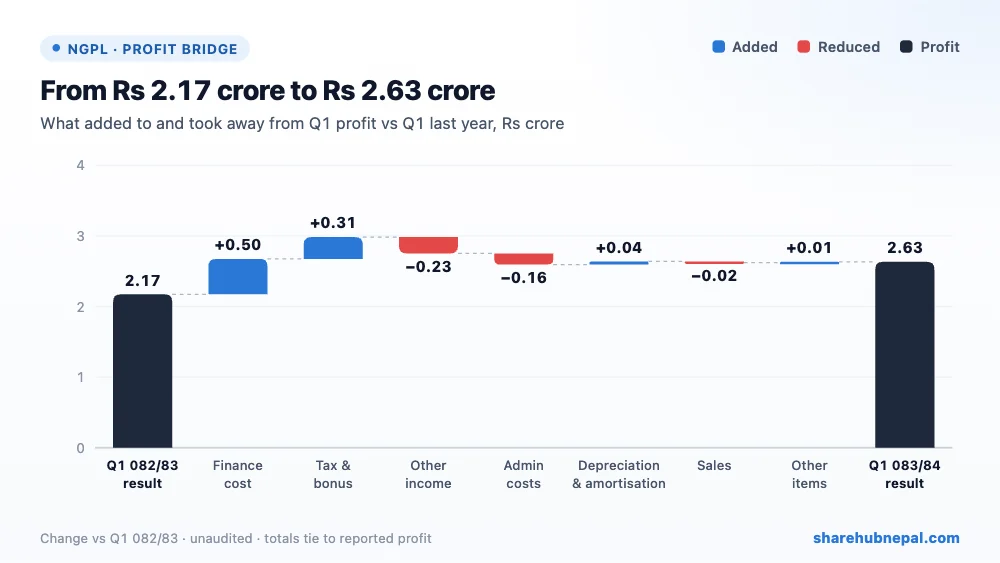
Lower finance cost added Rs 50.13 lakh and lower tax and bonus Rs 30.88 lakh; depreciation and royalty/cost of sales were also a little lower. Against that, non-operating income fell by Rs 23.12 lakh and admin cost rose by Rs 15.69 lakh. Net effect: profit up Rs 46.06 lakh.
2. Profit through the year
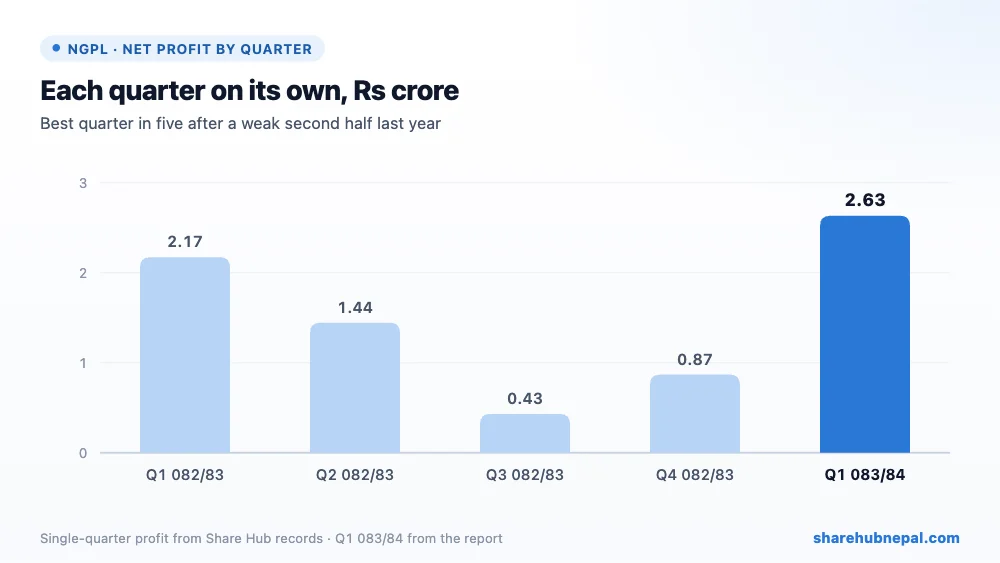
Profit by quarter (Share Hub records): Q1 082/83: Rs 2.17 crore, Q2 082/83: Rs 1.44 crore, Q3 082/83: Rs 43.04 lakh, Q4 082/83: Rs 86.81 lakh, Q1 083/84: Rs 2.63 crore. FY 2082/83 profit was Rs 4.92 crore (EPS Rs 1.27); this single quarter is more than half of that.
3. Debt and balance sheet
| Particulars | Ashwin 2083 | Ashad 2083 | Change |
| Total assets | Rs 6,404,696,099 | Rs 6,441,420,701 | −0.57% |
| Total equity | Rs 5,367,692,257 | Rs 5,365,699,370 | +0.04% |
| Long-term borrowings | Rs 330,000,000 | Rs 338,137,751 | −2.41% |
| Current borrowings | Rs 54,000,000 | Rs 60,453,701 | −10.68% |
| Cash and equivalents | Rs 157,943,727 | Rs 368,432,383 | −57.13% |
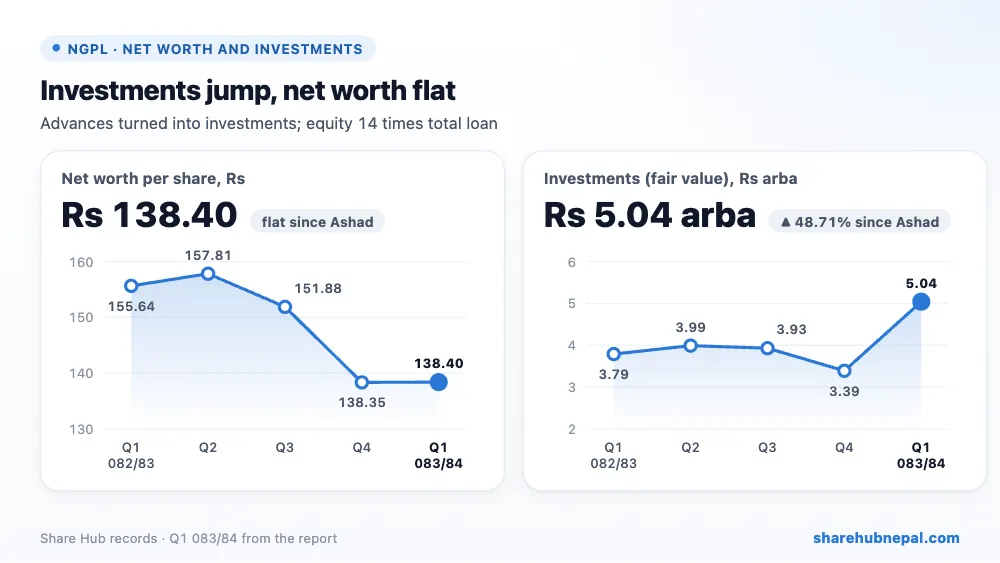
NGPL is mainly an investment holding company with one plant. Investments, shown at fair value, rose 48.71% to Rs 5.04 arba while advances fell from Rs 2.15 arba to Rs 68.55 crore and cash from Rs 36.84 crore to Rs 15.79 crore, so money seems to have moved from advances into investments; the report lists SMJC, MKHL and Siuri Nyadi Power shares worth Rs 3.33 arba and does not itemise the rest. Equity is almost unchanged at Rs 5.37 arba (Rs 138.40 per share) because the profit was offset by a fall in other equity. Total bank loan is only Rs 38.40 crore.
4. Per-share figures and valuation
| Indicator | Value |
| EPS (annualised) | Rs 2.72 |
| Net worth per share | Rs 138.40 |
| Market price (Ashwin end) | Rs 398 |
| P/E (annualised) | 146.32x |
| P/B | 2.88x |
At the Ashwin-end price of Rs 398, the share trades at 146.32 times annualised EPS and 2.88 times net worth per share. Earnings are small for the size of the balance sheet; much of the value depends on the market price of the shares it holds.
Conclusion
Positives: profit up 21%, finance cost almost halved, low debt, current ratio 2.27, plant fully running.
Watch: flat power sales, lower other income, higher admin cost, Rs 1.71 arba of investments not itemised, value tied to share prices of other hydros, P/E above 140.
A cleaner quarter thanks to lower interest and tax, but NGPL's results and net worth will keep moving with the value of its hydro investments more than with its own plant.
Figures are from the company's unaudited Q1 report; quarter trends use Share Hub records. This is not investment advice.

