













Nepal Insurance Co. Ltd – First Quarter Analysis, FY 2083/84
Unaudited results as on Ashwin end 2083, compared with the same quarter last year (Ashwin end 2082) and with Ashad end 2083.
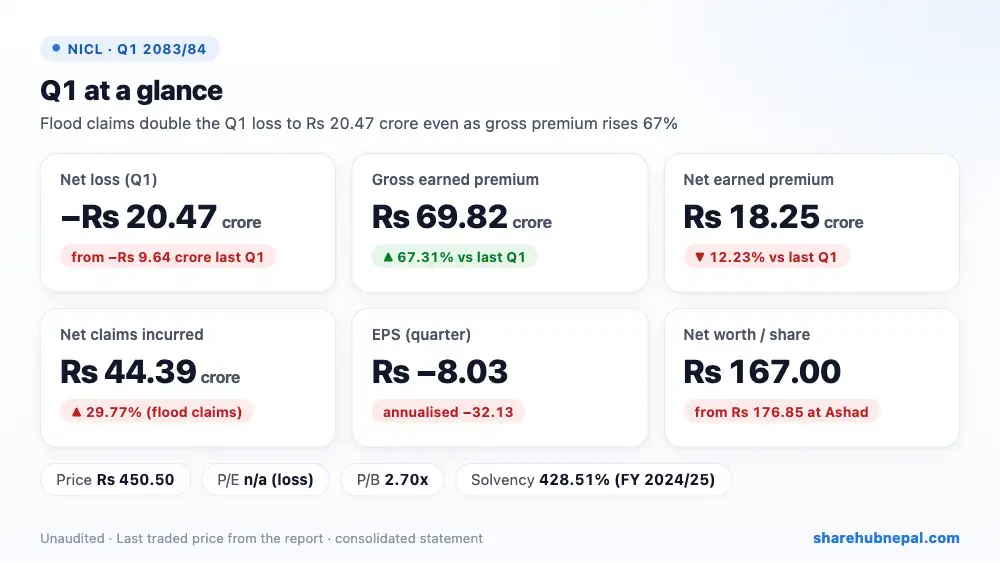
Summary
Nepal Insurance made a net loss of Rs 20.47 crore in the first quarter of FY 2083/84, more than double the Rs 9.64 crore loss a year ago. Gross earned premium jumped 67.31% to Rs 69.82 crore, but the company passed most of it to reinsurers, so its own net premium fell 12.23% to Rs 18.25 crore. At the same time net claims rose 29.77% to Rs 44.39 crore — 2.4 times net premium — because the Bhadra flash floods in Bhotekoshi, Rasuwa and other areas damaged insured infrastructure, vehicles and property. Quarter EPS is Rs −8.03 (Rs −32.13 annualised) and net worth per share fell to Rs 167.
| Indicator | Q1 2083/84 | Q1 2082/83 | Change |
| Gross earned premium | Rs 698,226,137 | Rs 417,326,176 | +67.31% |
| Premium ceded to reinsurers | Rs 515,725,276 | Rs 209,387,449 | +146.30% |
| Net earned premium | Rs 182,500,861 | Rs 207,938,727 | −12.23% |
| Reinsurance commission income | Rs 45,832,570 | Rs 66,291,120 | −30.86% |
| Income from investments and loans | Rs 61,102,536 | Rs 50,230,139 | +21.65% |
| Net claims incurred | Rs 443,876,519 | Rs 342,054,388 | +29.77% |
| Employee benefits | Rs 64,663,137 | Rs 64,543,684 | +0.19% |
| Other operating expenses | Rs 33,055,760 | Rs 32,980,025 | +0.23% |
| Loss before tax | −Rs 273,131,786 | −Rs 137,683,825 | −98.38% |
| Income tax (credit) | −Rs 68,429,068 | −Rs 41,305,148 | −65.67% |
| Net loss | −Rs 204,702,718 | −Rs 96,378,678 | −112.39% |
| EPS (annualised) | -32.13 | -15.12 | – |
| Net worth per share | 167 | 171.58 | – |
1. Where the profit came from
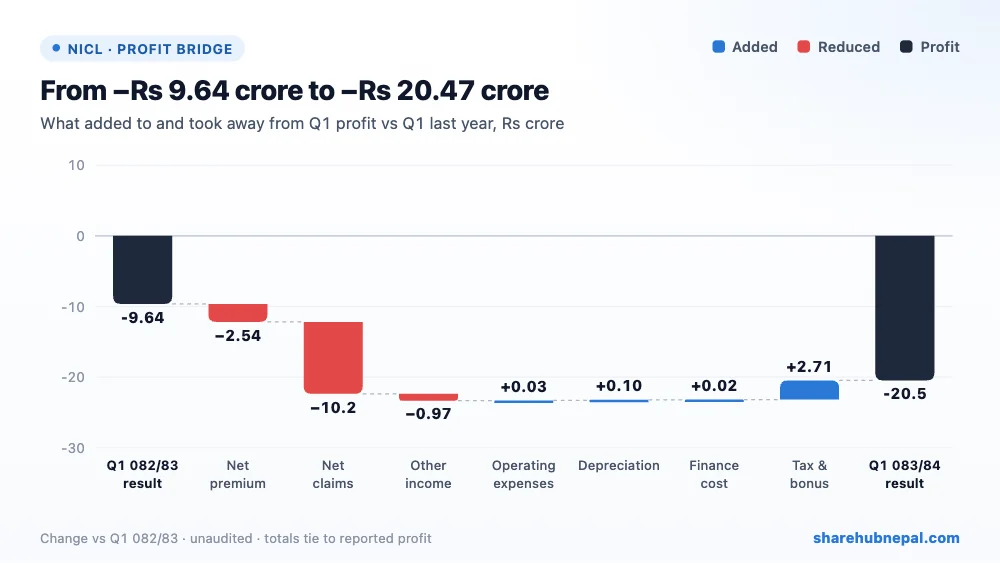
Net premium fell by Rs 2.54 crore and net claims rose by Rs 10.18 crore. Reinsurance commission income fell 30.86% to Rs 4.58 crore, partly offset by investment income up 21.65% to Rs 6.11 crore. Staff and other costs were flat. The loss before tax was Rs 27.31 crore, against Rs 13.77 crore a year ago; a tax credit of Rs 6.84 crore brought the net loss to Rs 20.47 crore. Other comprehensive income was also a loss of Rs 2.14 crore.
2. Profit through the year
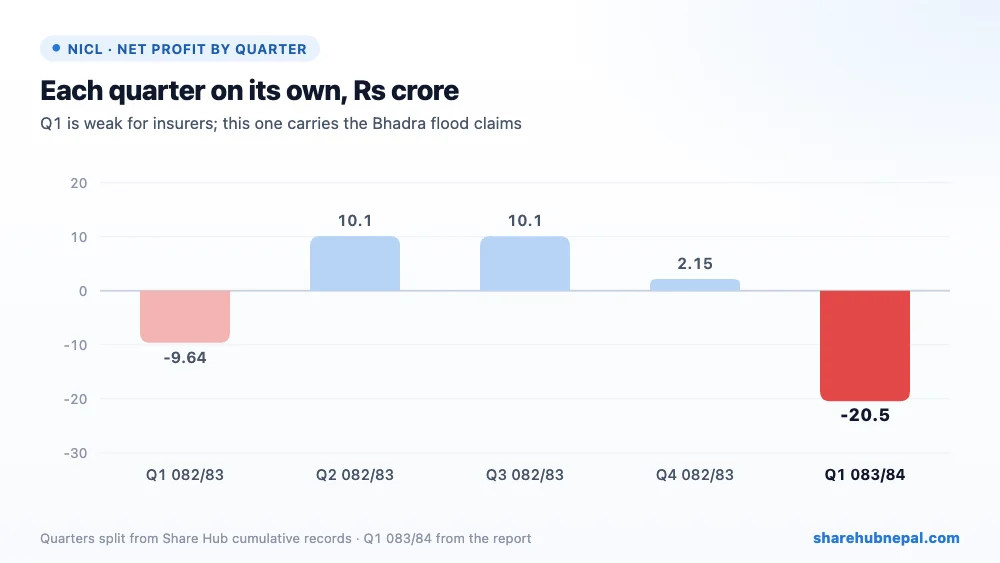
Profit by quarter (Share Hub cumulative records, split into quarters): Q1 082/83: −Rs 9.64 crore, Q2 082/83: Rs 10.13 crore, Q3 082/83: Rs 10.11 crore, Q4 082/83: Rs 2.15 crore, Q1 083/84: −Rs 20.47 crore. Last year Q1 was also a loss (Rs 9.64 crore), but Q2 and Q3 earned about Rs 10 crore each and the year ended with a profit of Rs 12.76 crore (EPS Rs 5.00). This year's Q1 loss is already bigger than last year's full-year profit.
3. Debt and balance sheet
| Particulars | Ashwin 2083 | Ashad 2083 | Change |
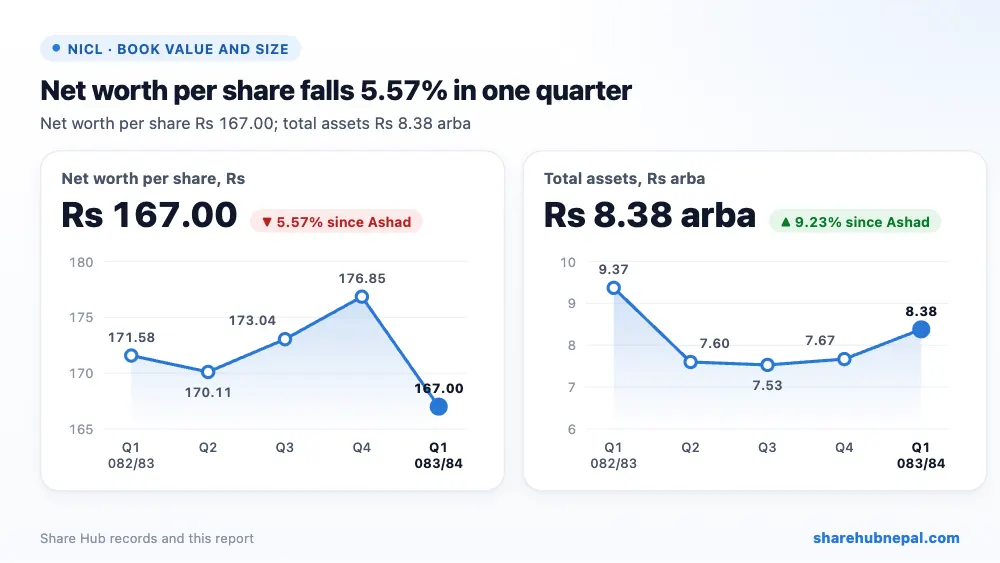
| Total assets | Rs 8,377,060,009 | Rs 7,669,079,588 | +9.23% |
| Investments | Rs 5,342,118,730 | Rs 5,505,466,044 | −2.97% |
| Reinsurance assets | Rs 1,743,711,239 | Rs 1,234,588,314 | +41.24% |
| Gross insurance contract liabilities | Rs 3,413,190,879 | Rs 2,416,618,921 | +41.24% |
| Total equity | Rs 4,256,012,381 | Rs 4,507,220,250 | −5.57% |
| Cash and equivalents | Rs 144,183,985 | Rs 45,179,039 | +219.14% |
Insurance contract liabilities rose 41.24% to Rs 3.41 arba as flood claims were reserved, while reinsurance assets rose to Rs 1.74 arba, showing that reinsurers will carry a large part of the claims. Gross outstanding claims (incl. IBNR) are Rs 1.41 arba against Rs 94.33 crore a year ago. Investments are Rs 5.34 arba and there are no borrowings. Equity fell 5.57% to Rs 4.26 arba and retained earnings turned negative (Rs −14.74 crore). The solvency ratio is 428.51% (RBC-S, FY 2024/25).
4. Per-share figures and valuation
| Indicator | Value |
| EPS (annualised) | Rs -32.13 |
| Net worth per share | Rs 167.00 |
| Market price (Ashwin end) | Rs 450.5 |
| P/E (annualised) | -14.02x |
| P/B | 2.70x |
At the Ashwin-end price of Rs 450.5, the share trades at -14.02 times annualised EPS and 2.70 times net worth per share. With a loss the P/E is not meaningful. The share trades at about 2.7 times net worth per share; on last year's EPS of Rs 5.00 the P/E would be about 90 times.
Conclusion
Positives: gross premium up 67.31%, investment income up 21.65%, reinsurance covers much of the flood losses, no borrowings, a high solvency ratio, and no legal cases.
Watch: a Rs 20.47 crore loss, net premium down while claims rise, heavy reliance on reinsurance (74% of premium ceded), retained earnings now negative, net worth per share down 5.57%, and further flood claims may still come.
Watch Q2 results to see whether the flood claims were a one-off, how much reinsurers recover, and the trend in net premium.
Figures are from the company's unaudited Q1 report; quarter trends use Share Hub records. This is not investment advice.

