













Neco Insurance Ltd – First Quarter Analysis, FY 2083/84
Unaudited results as on Ashwin end 2083, compared with the same quarter last year (Ashwin end 2082) and with Ashad end 2083.
Summary
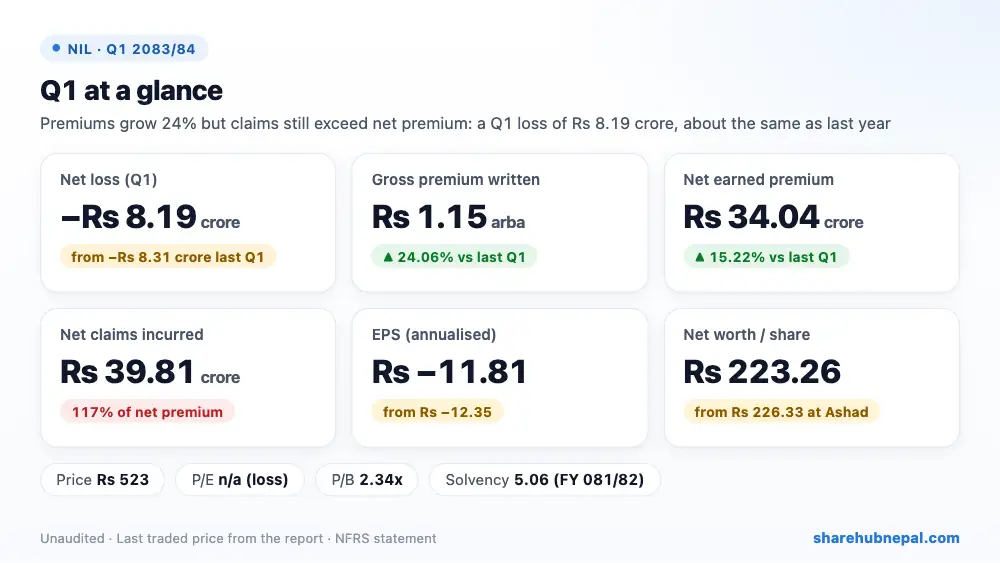
Neco Insurance made a net loss of Rs 8.19 crore in the first quarter of FY 2083/84, slightly smaller than the Rs 8.31 crore loss a year ago. Business grew: gross premium written rose 24.06% to Rs 1.15 arba and net earned premium rose 15.22% to Rs 34.04 crore. But net claims of Rs 39.81 crore were still higher than net premium, investment income fell 19.52% as interest rates dropped, and staff and other costs rose. A tax credit of Rs 3.51 crore reduced the loss. Annualised EPS is Rs −11.81 and net worth per share is Rs 223.26.
| Indicator | Q1 2083/84 | Q1 2082/83 | Change |
| Gross earned premium | Rs 573,714,710 | Rs 526,282,812 | +9.01% |
| Net earned premium | Rs 340,370,592 | Rs 295,407,344 | +15.22% |
| Reinsurance commission income | Rs 96,832,706 | Rs 100,448,783 | −3.60% |
| Income from investments and loans | Rs 42,557,035 | Rs 52,876,057 | −19.52% |
| Net realised gains | Rs 4,762,473 | Rs 15,609,869 | −69.49% |
| Net claims incurred | Rs 398,133,179 | Rs 408,657,730 | −2.58% |
| Employee benefits | Rs 120,834,320 | Rs 109,850,196 | +10.00% |
| Other operating expenses | Rs 50,081,259 | Rs 38,030,759 | +31.69% |
| Loss before tax | −Rs 116,959,374 | −Rs 118,763,795 | +1.52% |
| Income tax (credit) | −Rs 35,087,812 | −Rs 35,629,139 | +1.52% |
| Net loss | −Rs 81,871,562 | −Rs 83,134,656 | +1.52% |
| EPS (annualised) | -11.81 | -12.35 | – |
| Net worth per share | 223.26 | 227.15 | – |
1. Where the profit came from
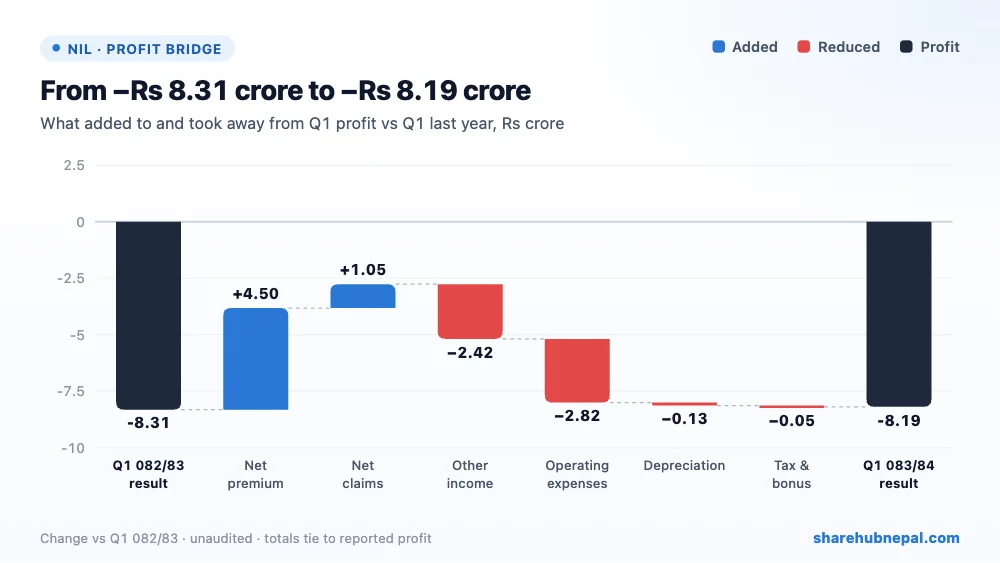
Net earned premium rose by Rs 4.50 crore and net claims fell by Rs 1.05 crore, so the underwriting result improved. But commission and investment income fell by Rs 2.42 crore (reinsurance commission −3.60%, investment income −19.52%, realised gains down from Rs 1.56 crore to Rs 47.62 lakh), while staff, commission and other operating costs rose by Rs 2.82 crore (other operating expenses +31.69%). The result is a loss before tax of Rs 11.70 crore, about the same as last year.
2. Profit through the year
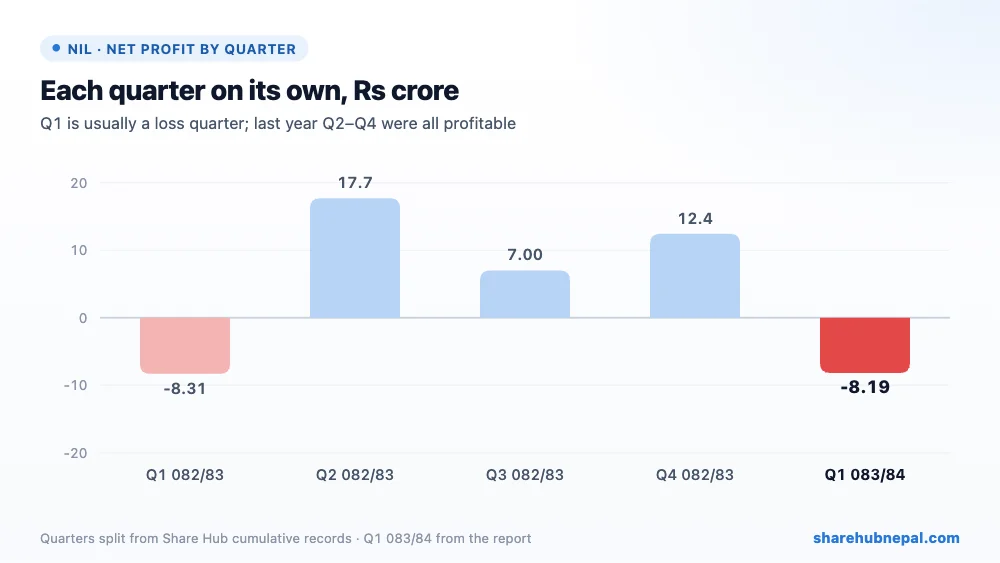
Profit by quarter (Share Hub cumulative records, split into quarters): Q1 082/83: −Rs 8.31 crore, Q2 082/83: Rs 17.70 crore, Q3 082/83: Rs 7.00 crore, Q4 082/83: Rs 12.44 crore, Q1 083/84: −Rs 8.19 crore. Last year followed the same pattern: a Q1 loss of Rs 8.31 crore, then profits in Q2 (Rs 17.70 crore), Q3 (Rs 7.00 crore) and Q4 (Rs 12.44 crore), for a full-year profit of Rs 28.83 crore (EPS Rs 10.40). So a Q1 loss is not unusual for Neco, and annualising it is misleading.
3. Debt and balance sheet
| Particulars | Ashwin 2083 | Ashad 2083 | Change |
| Total assets | Rs 13,292,962,550 | Rs 12,158,069,832 | +9.33% |
| Investments | Rs 6,005,472,164 | Rs 6,199,164,851 | −3.12% |
| Reinsurance assets | Rs 3,274,223,766 | Rs 2,740,055,722 | +19.49% |
| Gross insurance contract liabilities | Rs 5,813,825,607 | Rs 4,857,234,481 | +19.69% |
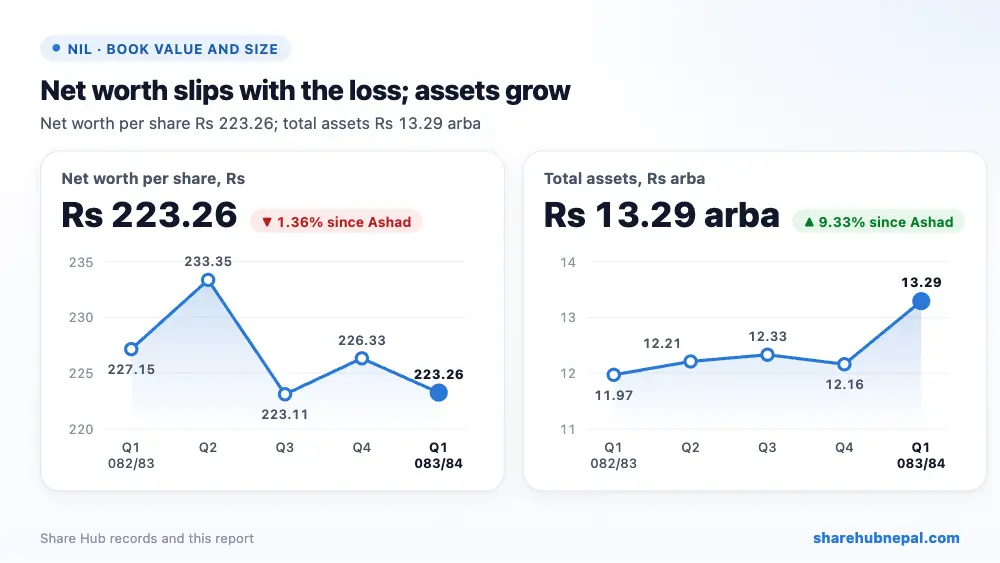
| Total equity | Rs 6,189,461,873 | Rs 6,274,619,962 | −1.36% |
| Cash and equivalents | Rs 2,442,648,181 | Rs 1,575,345,264 | +55.05% |
The balance sheet is strong. Total assets grew 9.33% to Rs 13.29 arba, cash rose to Rs 2.44 arba and investments are Rs 6.01 arba. Insurance contract liabilities rose 19.69% to Rs 5.81 arba as business grew, but reinsurance assets of Rs 3.27 arba cover much of them. The company has no borrowings and a solvency ratio of 5.06 (FY 2081/82). Equity fell 1.36% to Rs 6.19 arba.
4. Per-share figures and valuation
| Indicator | Value |
| EPS (annualised) | Rs -11.81 |
| Net worth per share | Rs 223.26 |
| Market price (Ashwin end) | Rs 523 |
| P/E (annualised) | -44.28x |
| P/B | 2.34x |
At the Ashwin-end price of Rs 523, the share trades at -44.28 times annualised EPS and 2.34 times net worth per share. With a Q1 loss the P/E is not meaningful (the report prints −44.27). On last year's EPS of Rs 10.40 the P/E would be about 50 times; the share trades at 2.34 times book value.
Conclusion
Positives: premium written up 24.06%, net claims down 2.58%, a slightly smaller loss than last year, no borrowings, Rs 2.44 arba of cash, a solvency ratio of 5.06, and no legal cases.
Watch: claims still exceed net premium, investment income is falling with interest rates, staff and other costs are rising, net worth per share slipped, and Q1 results for insurers are seasonal.
Watch whether Neco returns to profit in Q2 as last year, the claims ratio, and investment income.
Figures are from the company's unaudited Q1 report; quarter trends use Share Hub records. This is not investment advice.

