













National Life Insurance Company Limited – First Quarter Analysis, FY 2083/84
Unaudited results as on Ashwin end 2083, compared with the same quarter last year (Ashwin end 2082) and with Ashad end 2083.
Summary
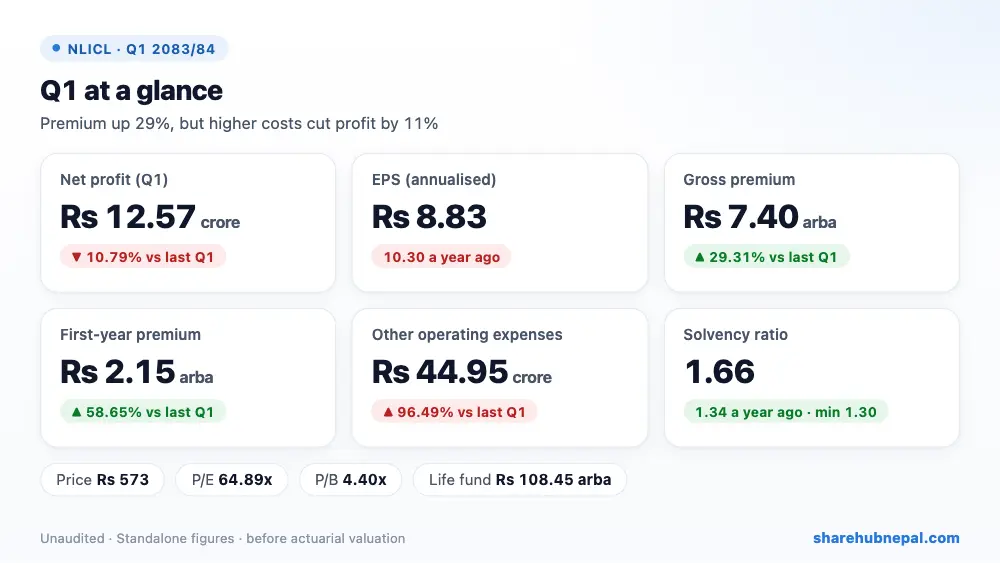
National Life Insurance earned a standalone net profit of Rs 12.57 crore in the first quarter, down 10.79% from Rs 14.09 crore a year ago. Annualised EPS is Rs 8.83 (Rs 10.30 last year). The group profit, which adds its subsidiaries NLG Insurance and National Capital, was much higher at Rs 20.42 crore.
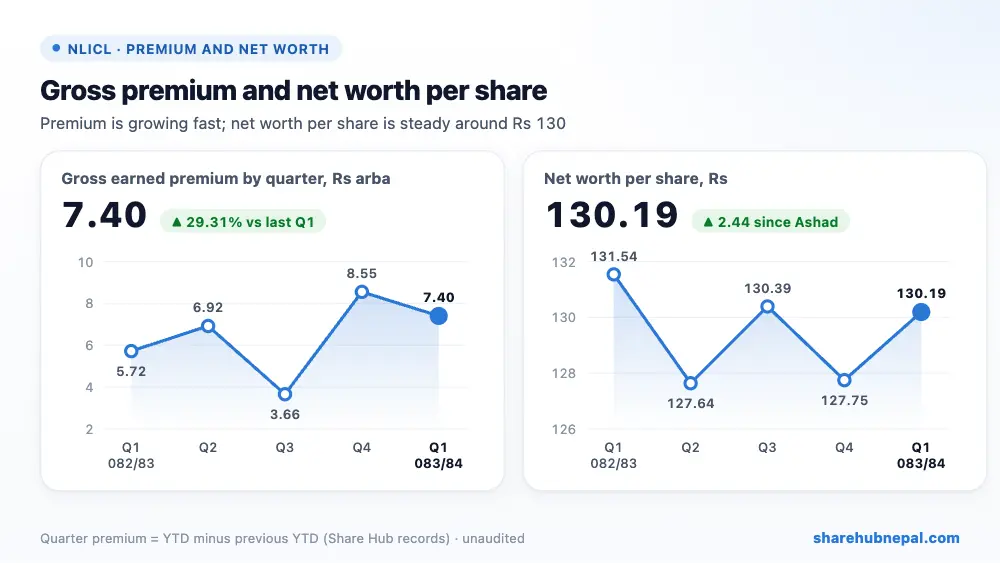
Business grew strongly: gross premium rose 29.31% to Rs 7.40 arba, with first-year premium up 58.65% to Rs 2.15 arba and renewal premium up 20.19%. Investment and policy-loan income rose 12.55% to Rs 1.98 arba. But net benefits and reserve additions rose 26.19% to Rs 7.64 arba, commission rose 21.21%, staff cost 23.81%, and other operating expenses almost doubled (+96.49%) to Rs 44.95 crore. Tax took 54.77% of profit before tax.
| Indicator | Q1 2083/84 | Q1 2082/83 | Change |
| Gross earned premium | Rs 7,397,292,711 | Rs 5,720,647,681 | +29.31% |
| First-year premium (incl. single) | Rs 2,152,683,677 | Rs 1,356,860,658 | +58.65% |
| Renewal premium | Rs 5,244,609,033 | Rs 4,363,787,023 | +20.18% |
| Net earned premium | Rs 7,195,630,244 | Rs 5,529,414,328 | +30.13% |
| Investment and policy-loan income | Rs 1,979,695,037 | Rs 1,758,940,275 | +12.55% |
| Net benefits, claims and reserve change | Rs 7,641,065,530 | Rs 6,055,165,022 | +26.19% |
| Commission and service fees | Rs 632,586,350 | Rs 518,663,771 | +21.96% |
| Employee and other operating expenses | Rs 652,956,799 | Rs 395,360,652 | +65.15% |
| Profit before tax | Rs 277,873,418 | Rs 342,236,173 | −18.81% |
| Net profit | Rs 125,682,967 | Rs 140,885,661 | −10.79% |
| EPS (annualised) | 8.83 | 10.30 | – |
1. Where the profit came from
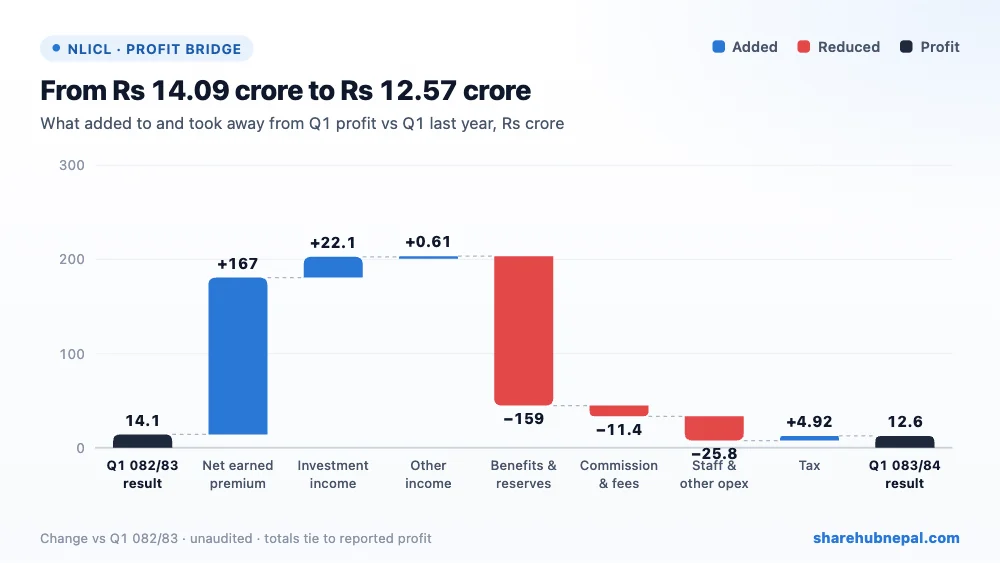
Compared with last year's Q1, higher net premium added Rs 166.62 crore, higher investment income Rs 22.08 crore and lower tax Rs 4.92 crore. Almost all of that went into higher benefits and reserves (Rs 158.59 crore), staff and other operating costs (Rs 25.76 crore) and commission and fees (Rs 11.39 crore). Net result: profit down Rs 1.52 crore.
2. Profit through the year
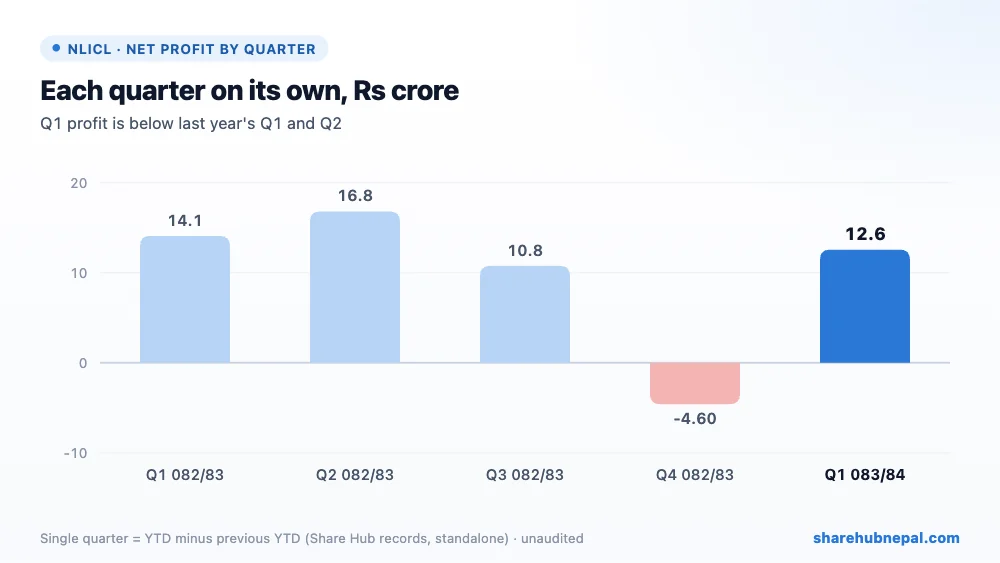
Based on Share Hub's standalone records, single-quarter profit in 2082/83 was Rs 14.09 crore in Q1, Rs 16.81 crore in Q2, Rs 10.77 crore in Q3 and a loss of Rs 4.60 crore in Q4 (full year Rs 37.06 crore, after the year-end adjustments). For life insurers the final profit depends on the year-end actuarial valuation, so quarterly profit is only a rough guide.
3. Balance sheet and solvency
| Particulars | Ashwin 2083 | Ashad 2083 | Change |
| Investments | Rs 93,972,707,083 | Rs 93,819,815,083 | +0.16% |
| Loans (mostly to policyholders) | Rs 12,522,883,899 | Rs 12,381,187,848 | +1.14% |
| Cash and cash equivalents | Rs 6,915,835,807 | Rs 1,802,787,475 | +283.62% |
| Insurance contract liabilities | Rs 110,685,439,368 | Rs 106,202,391,150 | +4.22% |
| Total assets | Rs 121,059,655,566 | Rs 116,934,116,663 | +3.53% |
| Total equity | Rs 7,409,751,138 | Rs 7,270,900,537 | +1.91% |
Total assets (standalone) grew 3.53% in the quarter to Rs 121.06 arba, mostly held in investments (Rs 93.97 arba) and policyholder loans (Rs 12.52 arba). Cash rose to Rs 6.92 arba from Rs 1.80 arba while other financial assets fell. Insurance contract liabilities rose to Rs 110.69 arba. Equity is Rs 7.41 arba; it rose Rs 13.89 crore in the quarter, Rs 13.51 crore less than total comprehensive income (not explained). The solvency ratio improved to 1.66 from 1.34 a year ago, above the 1.30 minimum.
4. Per-share figures and valuation
| Indicator | Value |
| EPS (annualised) | Rs 8.83 |
| Net worth per share | Rs 130.19 |
| Total assets per share | Rs 2,126.97 |
| Market price (last trade) | Rs 573 |
| P/E (report) | 64.89x |
| P/B | 4.40x |
| Solvency ratio | 1.66 |
At Rs 573 the share trades at 64.89 times annualised EPS and 4.40 times net worth per share.
Conclusion
Positives: premium up 29.31% with strong new business (first-year premium +58.65%), rising investment income, a life fund of Rs 108.45 arba, a better solvency ratio (1.66) and a management expense ratio of 17.38%, well under the 30% limit.
Watch: profit down despite strong growth, other operating expenses nearly doubled, a high tax charge, fewer new policies (91,274 vs 96,674), a Rs 1.20 arba tax dispute with the Inland Revenue Department, and a high P/E of 64.89.
National Life is growing its premium fast and its balance sheet is getting stronger, but costs grew faster than profit this quarter. Watch whether operating expenses settle down and what the year-end actuarial valuation shows.
Figures are from the company's unaudited Q1 report; quarter trends use Share Hub records. This is not investment advice.

