













Nepal Micro Insurance Company Limited – First Quarter Analysis, FY 2083/84
Unaudited results as on Ashwin end 2083, compared with the same quarter last year (Ashwin end 2082) and with Ashad end 2083.
Summary
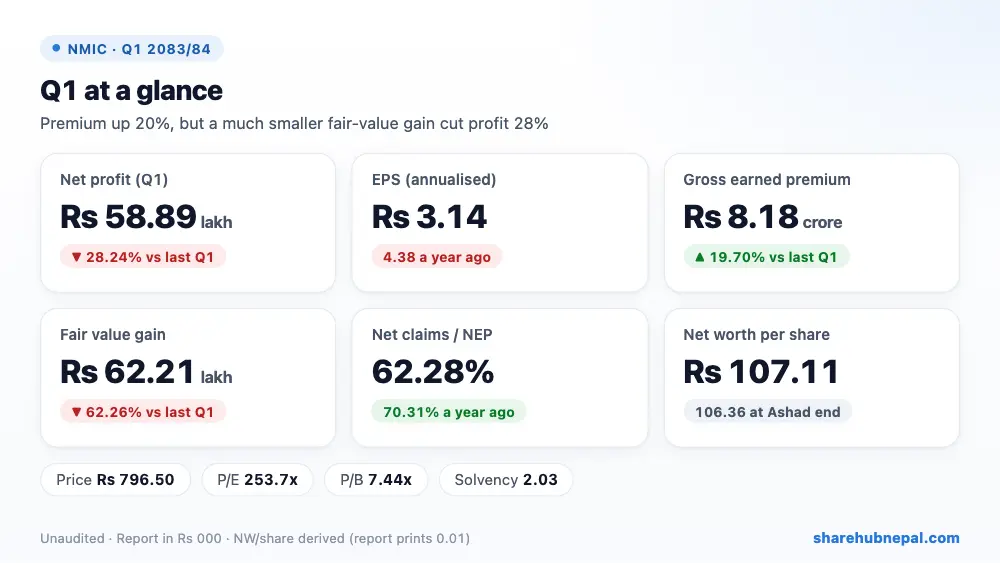
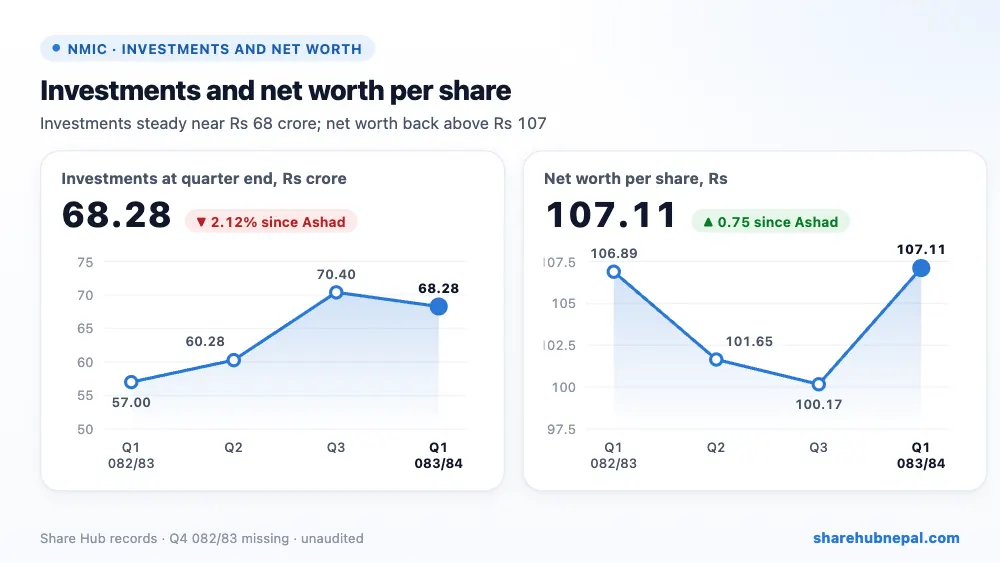
Nepal Micro Insurance earned a net profit of Rs 58.89 lakh in the first quarter of 2083/84, down 28.24% from Rs 82.07 lakh a year ago. Annualised EPS is Rs 3.14 (Rs 4.38 last year). Net worth per share works out to Rs 107.11 from the balance sheet; the report itself prints 0.01, which is a misprint.
The insurance business itself did better: gross earned premium rose 19.70% to Rs 8.18 crore, net earned premium rose 25.66% to Rs 3.30 crore, and net claims took 62.28% of net premium against 70.31% last year. The fall in profit came almost entirely from a much smaller fair value gain on investments — Rs 62.21 lakh against Rs 1.65 crore last year. Without that, operating results improved.
| Indicator | Q1 2083/84 | Q1 2082/83 | Change |
| Gross earned premium | Rs 81,755,060 | Rs 68,299,220 | +19.70% |
| Net earned premium | Rs 32,998,630 | Rs 26,259,840 | +25.66% |
| Commission income (from reinsurers) | Rs 10,396,580 | Rs 9,331,210 | +11.42% |
| Investment income | Rs 8,799,860 | Rs 7,385,090 | +19.16% |
| Fair value gain | Rs 6,221,130 | Rs 16,482,300 | −62.26% |
| Net claims incurred | Rs 20,551,650 | Rs 18,462,410 | +11.32% |
| Staff costs | Rs 17,596,380 | Rs 14,672,460 | +19.93% |
| Other operating expenses | Rs 9,164,230 | Rs 13,469,320 | −31.96% |
| Profit before tax | Rs 8,413,450 | Rs 10,320,130 | −18.48% |
| Income tax | Rs 2,524,040 | Rs 2,112,950 | +19.46% |
| Net profit | Rs 5,889,420 | Rs 8,207,180 | −28.24% |
| EPS (annualised) | 3.14 | 4.38 | – |
1. Where the profit came from
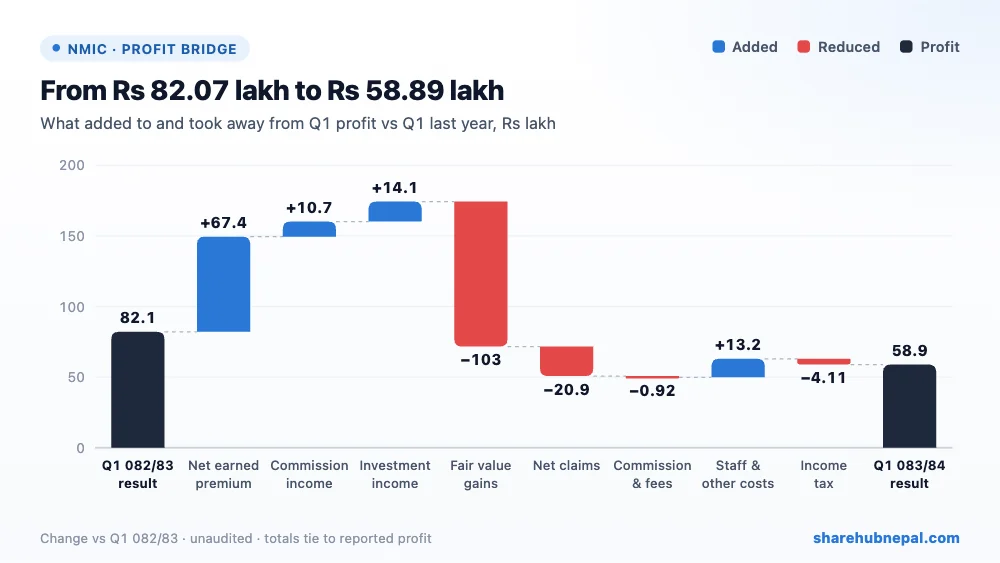
Compared with last year's Q1, higher net earned premium added Rs 67.39 lakh, commission income from reinsurers Rs 10.65 lakh, investment income Rs 14.15 lakh and lower staff and other costs Rs 13.16 lakh. Against that, the smaller fair value gain took away Rs 1.03 crore, higher net claims Rs 20.89 lakh, commission and fees Rs 91,620 and higher tax Rs 4.11 lakh. The net result is Rs 23.18 lakh less profit.
2. Profit through the year
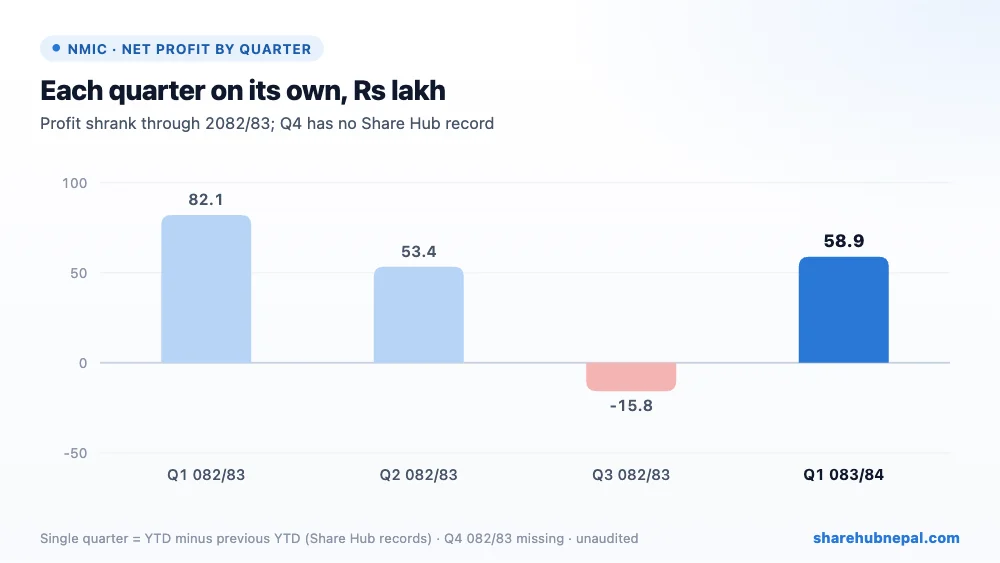
Based on Share Hub's records, single-quarter profit in 2082/83 was Rs 82.07 lakh in Q1, Rs 53.39 lakh in Q2 and a loss of Rs 15.80 lakh in Q3 (Share Hub has no Q4 2082/83 record for NMIC). So profit weakened through last year, and this Q1 is lower than last year's Q1 too. The annualised EPS of Rs 3.14 assumes every quarter matches Q1, which did not happen last year.
3. Debt and balance sheet
| Particulars | Ashwin 2083 | Ashad 2083 | Change |
| Investments | Rs 682,759,820 | Rs 697,538,700 | −2.12% |
| Reinsurance assets | Rs 123,420,670 | Rs 153,629,810 | −19.66% |
| Cash and cash equivalents | Rs 29,573,240 | Rs 74,159,580 | −60.12% |
| Gross insurance contract liabilities | Rs 188,329,750 | Rs 259,178,390 | −27.34% |
| Total equity | Rs 803,305,130 | Rs 797,688,240 | +0.70% |
| Total assets | Rs 1,113,284,760 | Rs 1,188,157,420 | −6.30% |
Total assets are Rs 1.11 arba (down from Rs 1.19 arba at Ashad end), mostly investments of Rs 68.28 crore. Long-term investments rose to Rs 24.91 crore from Rs 2.41 crore a year ago while short-term deposits fell to Rs 27.48 crore from Rs 54.58 crore — money moved into longer deposits. Cash fell to Rs 2.96 crore from Rs 7.42 crore. Insurance contract liabilities dropped to Rs 18.83 crore from Rs 25.92 crore as claims reserves were released. Equity is Rs 80.33 crore with Rs 75 crore paid-up capital; it rose Rs 2.73 lakh less than the Q1 profit because other equity fell, which the report does not explain.
4. Per-share figures and valuation
| Indicator | Value |
| EPS (annualised) | Rs 3.14 |
| Net worth per share (derived) | Rs 107.11 |
| Market price (Q1 close) | Rs 796.50 |
| P/E | 253.7x |
| P/B | 7.44x |
| Solvency ratio | 2.03 (1.96 last year) |
The Q1 closing price was Rs 796.50 (range Rs 765.30 to Rs 990). That is about 254 times annualised EPS and 7.44 times net worth per share — very expensive for the profit the company makes. The solvency ratio is 2.03, up from 1.96, and the report says there are no material legal cases.
Conclusion
Positives: premium growth of about 20%, better claims ratio (62% of net premium against 70%), higher investment and reinsurance commission income, lower other operating costs, and a slightly better solvency ratio.
Watch: profit depending on fair value gains (they fell 62%), direct premium written down 9.30% to Rs 6.38 crore, fewer new policies (21,486 against 23,804), staff costs up 19.93%, the misprinted net worth per share in the report, and a P/E of about 254.
The core micro-insurance business improved, but profit fell because last year's large investment gain did not repeat. The share price looks very high compared with the company's earnings.
Figures are from the company's unaudited Q1 report; quarter trends use Share Hub records. This is not investment advice.

