













Prabhu Insurance Ltd – First Quarter Analysis, FY 2083/84
Unaudited results as on Ashwin end 2083, compared with the same quarter last year (Ashwin end 2082) and with Ashad end 2083.
Summary
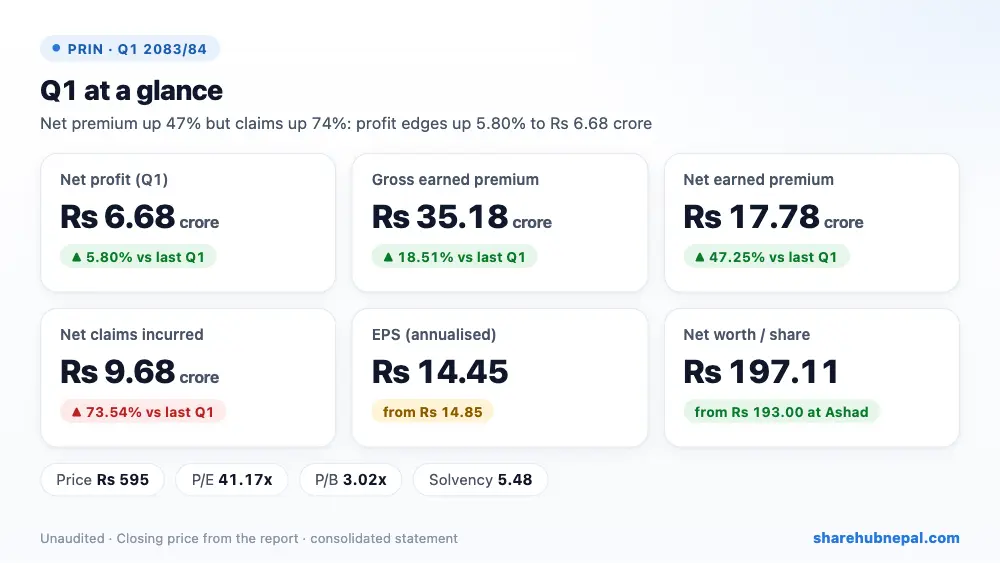
Prabhu Insurance earned a net profit of Rs 6.68 crore in the first quarter of FY 2083/84, up 5.80% from Rs 6.31 crore a year ago. It kept more of its business: gross earned premium rose 18.51% to Rs 35.18 crore, and because it ceded slightly less to reinsurers, net earned premium jumped 47.25% to Rs 17.78 crore. But net claims rose even faster, by 73.54% to Rs 9.68 crore, and depreciation rose sharply to Rs 82.87 lakh, so profit grew only a little. Annualised EPS is Rs 14.45 (Rs 14.85 last year) and net worth per share is Rs 197.11.
| Indicator | Q1 2083/84 | Q1 2082/83 | Change |
| Gross earned premium | Rs 351,803,934 | Rs 296,867,515 | +18.51% |
| Net earned premium | Rs 177,807,547 | Rs 120,752,703 | +47.25% |
| Reinsurance commission income | Rs 70,624,961 | Rs 63,364,363 | +11.46% |
| Income from investments and loans | Rs 55,393,983 | Rs 56,933,449 | −2.70% |
| Net claims incurred | Rs 96,786,587 | Rs 55,770,605 | +73.54% |
| Employee benefits | Rs 69,521,275 | Rs 68,933,374 | +0.85% |
| Other operating expenses | Rs 26,958,192 | Rs 21,079,121 | +27.89% |
| Depreciation and amortisation | Rs 8,286,570 | Rs 1,288,966 | +542.89% |
| Profit before tax | Rs 95,430,832 | Rs 90,199,643 | +5.80% |
| Income tax | Rs 28,629,250 | Rs 27,059,893 | +5.80% |
| Net profit | Rs 66,801,582 | Rs 63,139,750 | +5.80% |
| EPS (annualised) | 14.45 | 14.85 | – |
| Net worth per share | 197.11 | 202.27 | – |
1. Where the profit came from
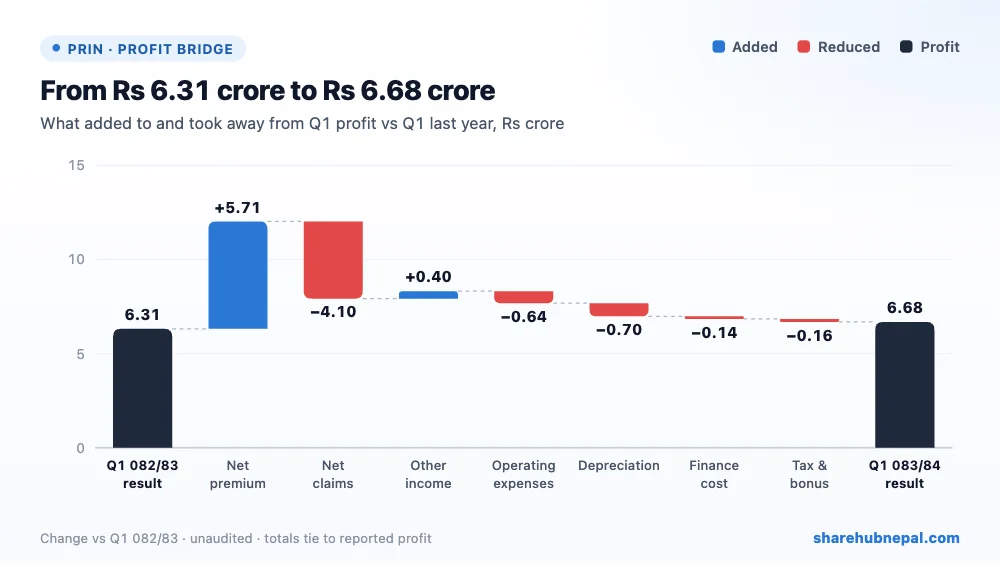
Higher net premium added Rs 5.71 crore and other income (commission and investments) Rs 39.70 lakh. Against this, net claims took Rs 4.10 crore more, staff and other operating costs Rs 63.73 lakh more, depreciation Rs 69.98 lakh more, and a new finance cost of Rs 14.07 lakh appeared. Profit before tax rose 5.80% to Rs 9.54 crore; after tax of Rs 2.86 crore, net profit was Rs 6.68 crore. OCI added Rs 66.53 lakh.
2. Profit through the year
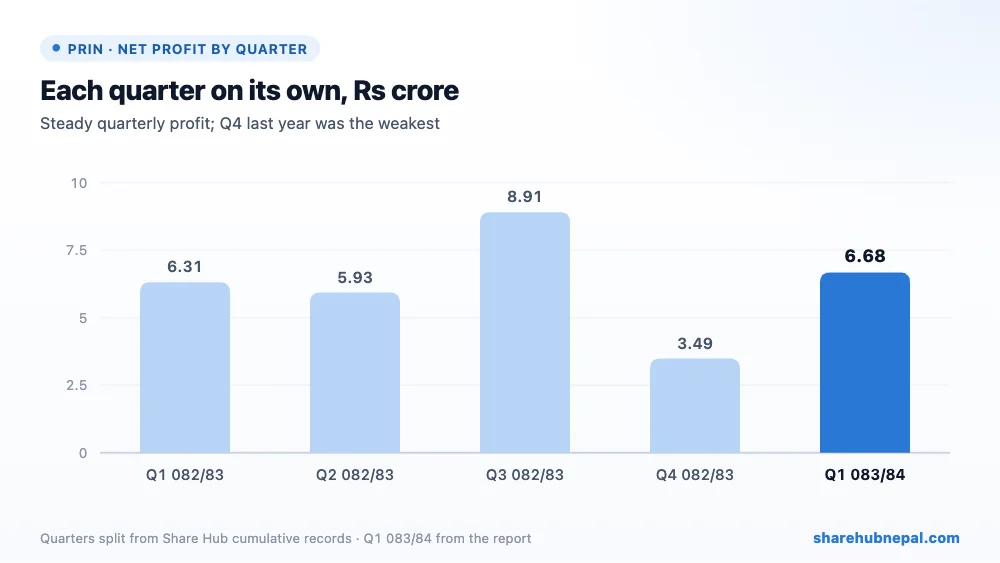
Profit by quarter (Share Hub cumulative records, split into quarters): Q1 082/83: Rs 6.31 crore, Q2 082/83: Rs 5.93 crore, Q3 082/83: Rs 8.91 crore, Q4 082/83: Rs 3.49 crore, Q1 083/84: Rs 6.68 crore. Prabhu has been profitable in every quarter: Rs 6.31 crore, Rs 5.93 crore, Rs 8.91 crore and Rs 3.49 crore last year (EPS Rs 13.33). This Q1 is in line with that steady pattern.
3. Debt and balance sheet
| Particulars | Ashwin 2083 | Ashad 2083 | Change |
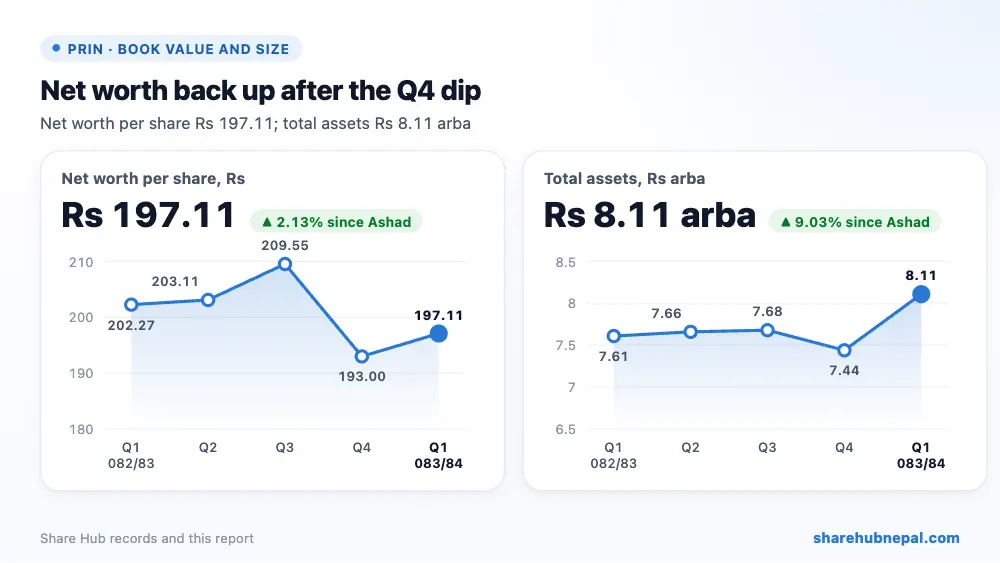
| Total assets | Rs 8,108,452,841 | Rs 7,437,160,112 | +9.03% |
| Investments | Rs 1,286,885,750 | Rs 1,288,608,275 | −0.13% |
| Reinsurance assets | Rs 2,922,504,567 | Rs 2,529,912,891 | +15.52% |
| Insurance receivables | Rs 1,352,084,517 | Rs 1,243,167,716 | +8.76% |
| Gross insurance contract liabilities | Rs 3,853,838,912 | Rs 3,164,006,030 | +21.80% |
| Total equity | Rs 3,644,506,248 | Rs 3,568,483,319 | +2.13% |
| Cash and equivalents | Rs 1,452,016,859 | Rs 1,356,723,272 | +7.02% |
Total assets grew 9.03% to Rs 8.11 arba. Cash is strong at Rs 1.45 arba and investments are Rs 1.29 arba, with no borrowings. Insurance receivables of Rs 1.35 arba are large compared with quarterly premium and worth watching. Insurance contract liabilities rose 21.80% to Rs 3.85 arba, partly covered by Rs 2.92 arba of reinsurance assets. Equity rose 2.13% to Rs 3.64 arba; solvency is 5.48.
4. Per-share figures and valuation
| Indicator | Value |
| EPS (annualised) | Rs 14.45 |
| Net worth per share | Rs 197.11 |
| Market price (Ashwin end) | Rs 595 |
| P/E (annualised) | 41.18x |
| P/B | 3.02x |
At the Ashwin-end price of Rs 595, the share trades at 41.18 times annualised EPS and 3.02 times net worth per share. This is in line with last year's full-year EPS of Rs 13.33 (P/E about 45), so the annualised figure looks realistic for Prabhu.
Conclusion
Positives: steady profit every quarter, net premium up 47.25%, gross premium up 18.51%, Rs 1.45 arba of cash, no borrowings, solvency of 5.48, and no legal cases.
Watch: net claims up 73.54%, depreciation up sharply without explanation, large insurance receivables, investment income slightly down, and the company names unhealthy competition among non-life insurers and interest rate risk.
Watch the claims ratio, collection of insurance receivables, and investment income in the coming quarters.
Figures are from the company's unaudited Q1 report; quarter trends use Share Hub records. This is not investment advice.

