













Shreenagar Agritech Industries Limited – First Quarter Analysis, FY 2083/84
Unaudited results as on Ashwin end 2083, compared with the same quarter last year (Ashwin end 2082).
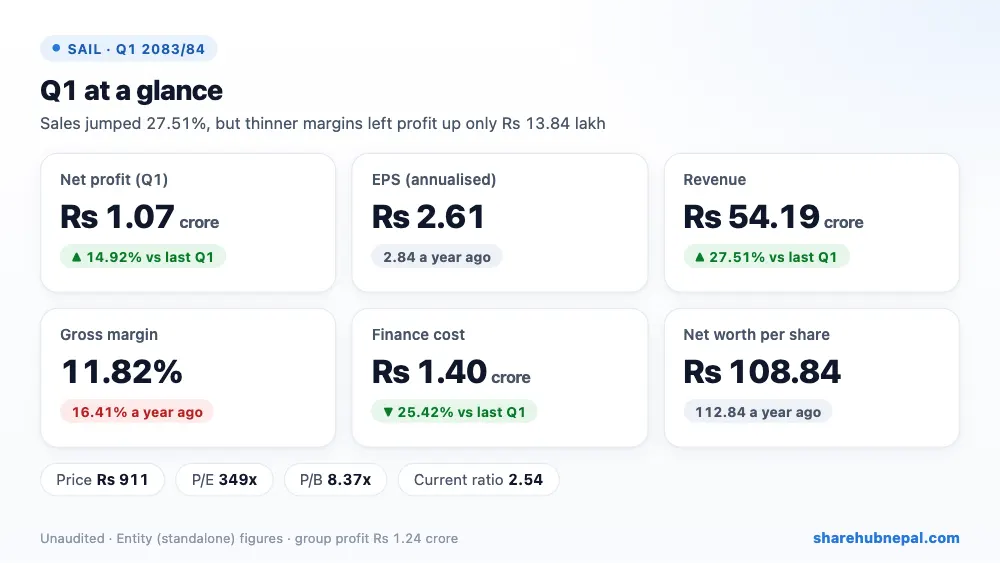
Summary
Shreenagar Agritech Industries (feed maker, brand SAF) earned a standalone net profit of Rs 1.07 crore in the first quarter of 2083/84, up 14.92% from Rs 92.75 lakh a year ago. With its subsidiary Sunaulo Agro Farm, group profit was Rs 1.24 crore (up 14.79%). Annualised EPS is Rs 2.61 on the enlarged capital of Rs 1.63 arba, against Rs 2.84 last year on Rs 1.31 arba.
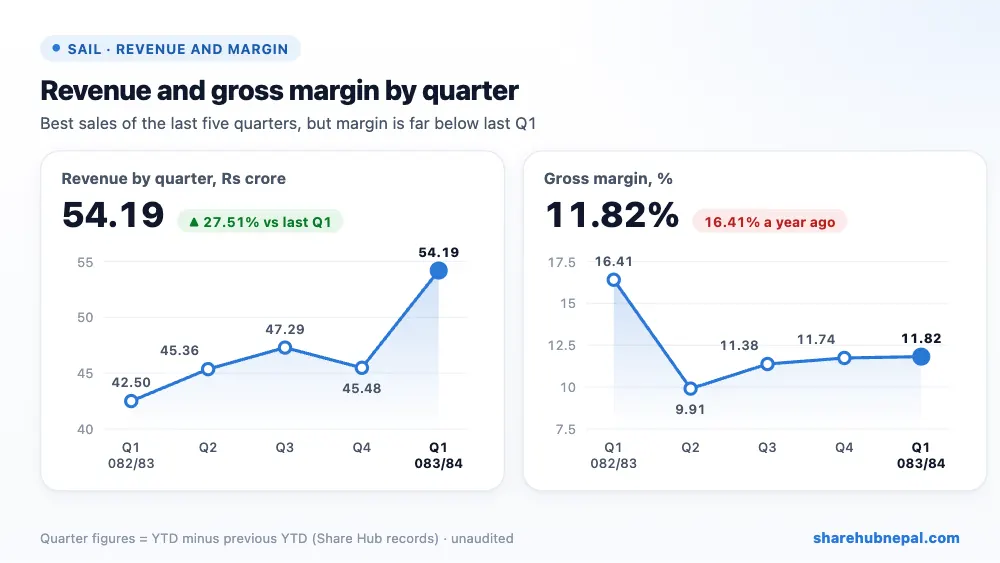
Sales grew strongly, up 27.51% to Rs 54.19 crore, the highest of the last five quarters. But cost of sales rose even faster (34.51%), so gross profit fell 8.17% to Rs 6.41 crore and the gross margin dropped to 11.82% from 16.41%. The company blames costlier raw materials from the weaker rupee and inflation. Profit still grew because finance cost fell 25.42%, staff cost fell 33.97%, other income rose to Rs 40.27 lakh and there was no tax this quarter; admin cost, however, rose 74.08%.
| Indicator | Q1 2083/84 | Q1 2082/83 | Change |
| Revenue | Rs 541,907,656 | Rs 424,996,905 | +27.51% |
| Cost of sales | Rs 477,850,457 | Rs 355,242,242 | +34.51% |
| Gross profit | Rs 64,057,199 | Rs 69,754,663 | −8.17% |
| Other income | Rs 4,026,801 | Rs 453,785 | +787.38% |
| Administrative expenses | Rs 20,283,665 | Rs 11,652,082 | +74.08% |
| Employee expenses | Rs 16,111,650 | Rs 24,398,587 | −33.96% |
| Depreciation and amortisation | Rs 7,024,906 | Rs 5,914,901 | +18.77% |
| Operating profit | Rs 24,663,781 | Rs 28,242,878 | −12.67% |
| Finance costs | Rs 14,004,934 | Rs 18,777,923 | −25.42% |
| Income tax | Rs 0 | Rs 190,167 | −100.00% |
| Net profit | Rs 10,658,847 | Rs 9,274,789 | +14.92% |
| EPS (annualised) | 2.61 | 2.84 | – |
1. Where the profit came from
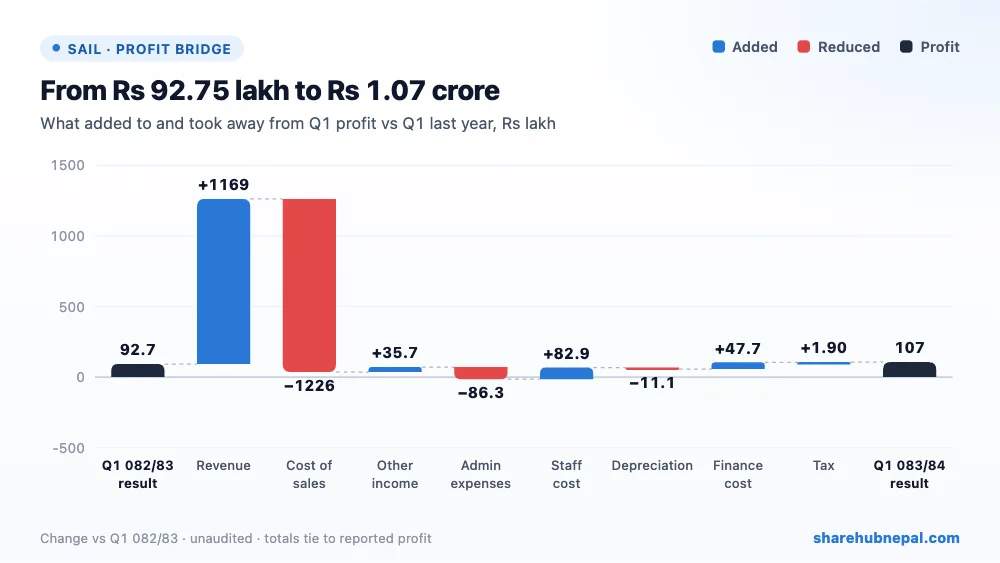
Compared with last year's Q1, higher sales added Rs 11.69 crore but higher cost of sales took away Rs 12.26 crore, so the extra sales did not add to profit. The gain came from lower staff cost (Rs 82.87 lakh), lower finance cost (Rs 47.73 lakh), higher other income (Rs 35.73 lakh) and no tax (Rs 1.90 lakh). Higher admin cost took away Rs 86.32 lakh and depreciation Rs 11.10 lakh. Net result: Rs 13.84 lakh more profit.
2. Profit through the year
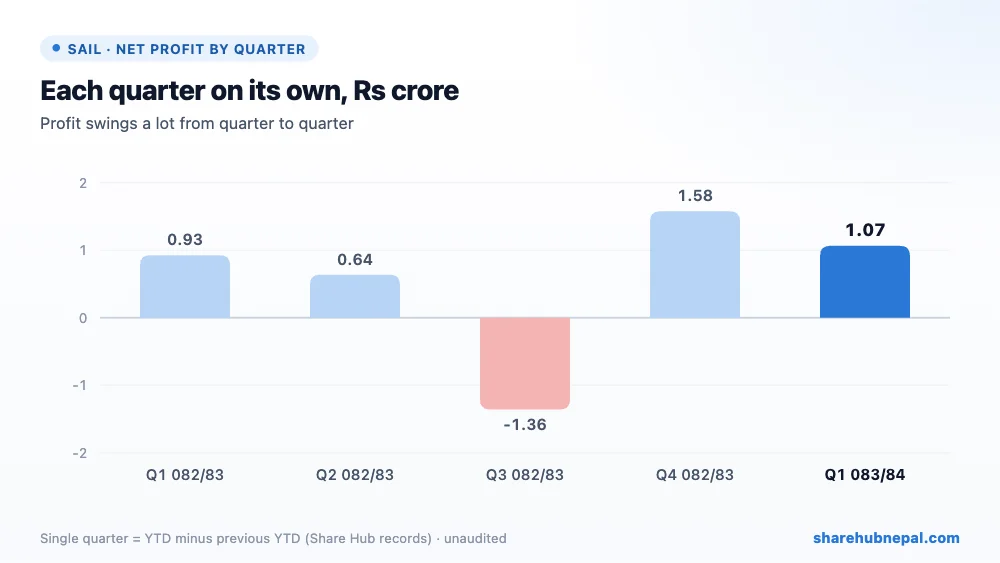
Based on Share Hub's records, single-quarter profit in 2082/83 was Rs 92.75 lakh in Q1, Rs 63.81 lakh in Q2, a loss of Rs 1.36 crore in Q3 and Rs 1.58 crore in Q4, for a full-year profit of Rs 1.78 crore. This Q1 alone is already 60% of last year's profit. Gross margin has stayed between 10% and 12% for four quarters now, well below the 16.41% of last year's Q1, so the higher sales are coming at lower margins.
3. Debt and balance sheet
| Particulars | Ashwin 2083 | Ashwin 2082 | Change |
| Property, plant and equipment | Rs 1,250,272,256 | Rs 1,218,856,531 | +2.58% |
| Inventories | Rs 638,743,209 | Rs 534,012,858 | +19.61% |
| Trade and other receivables | Rs 640,623,263 | Rs 601,894,642 | +6.43% |
| Long-term loan | Rs 675,445,000 | Rs 808,045,000 | −16.41% |
| Short-term loan | Rs 356,596,602 | Rs 308,427,076 | +15.62% |
| Current liabilities | Rs 568,037,740 | Rs 485,787,509 | +16.93% |
| Total equity | Rs 1,775,548,064 | Rs 1,547,965,805 | +14.70% |
Compared with a year ago, equity rose to Rs 1.78 arba after the right issue was completed, and total loans fell from Rs 1.12 arba to Rs 1.03 arba (long-term Rs 67.54 crore, short-term Rs 35.66 crore), about 0.58 times equity. Working capital is heavy: inventories are Rs 63.87 crore and receivables Rs 64.06 crore — together more than two quarters of sales — while cash is only Rs 1.99 crore. Operating profit covers interest just 1.76 times, so the business is still sensitive to interest rates and slow collections.
4. Per-share figures and valuation
| Indicator | Value |
| EPS (quarter, report) | Rs 0.65 |
| EPS (annualised) | Rs 2.61 |
| Net worth per share | Rs 108.84 |
| Total assets per share | Rs 186.27 |
| Market price (Q1 last trade) | Rs 911 |
| P/E (on annualised EPS) | 349x |
| P/B | 8.37x |
| Current ratio | 2.54 |
| Interest cover | 1.76x |
The last trade in the quarter was Rs 911 (range Rs 796.10 to Rs 1,229). On annualised EPS of Rs 2.61 the P/E is about 349 times, and the price is 8.37 times net worth per share of Rs 108.84. These are very high multiples for a feed business earning a return on equity of about 2.4%; the price is not supported by current earnings.
Conclusion
Positives: record quarterly sales (+27.51%), profit up 14.92%, lower loans and finance cost after the right issue, lower staff cost, current ratio 2.54, and new capacity being added (capital WIP Rs 4.44 crore).
Watch: the fall in gross margin to 11.82%, raw-material prices and the rupee, the 74.08% jump in admin cost, high inventories and receivables with little cash, thin interest cover, and a valuation (P/E above 300, P/B above 8) far ahead of earnings.
A decent quarter on the surface — record sales and higher profit — but the gain came from cost cuts and lower interest, not from the core business, because margins shrank. Watch whether SAF can pass higher material costs on to customers; until margins recover, profit growth will stay small compared with the share price.
Figures are from the company's unaudited Q1 report; quarter trends use Share Hub records. This is not investment advice.

