













Sarbottam Cement Limited – First Quarter Analysis, FY 2083/84
Unaudited results as on Ashwin end 2083, compared with the same quarter last year (Ashwin end 2082).
Summary
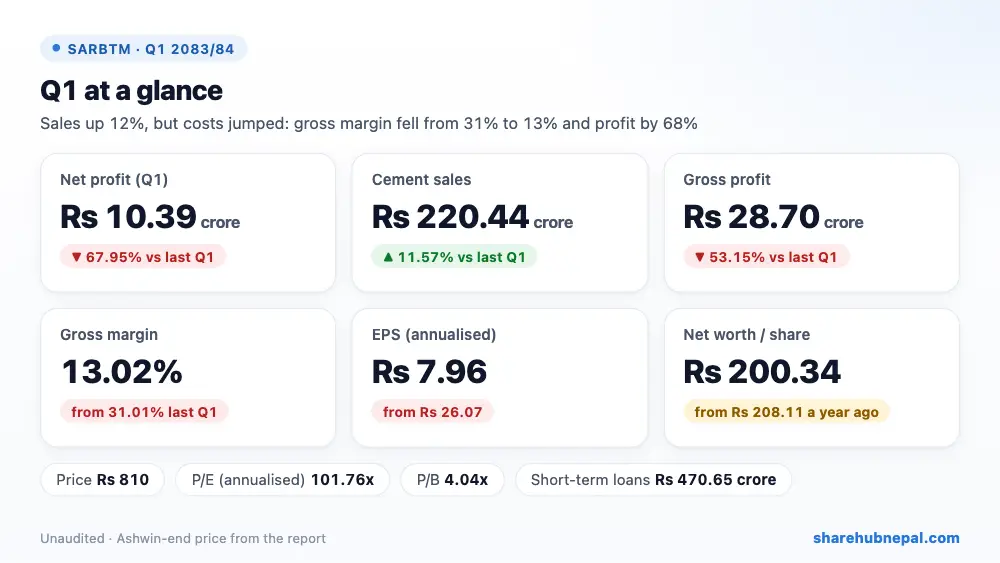
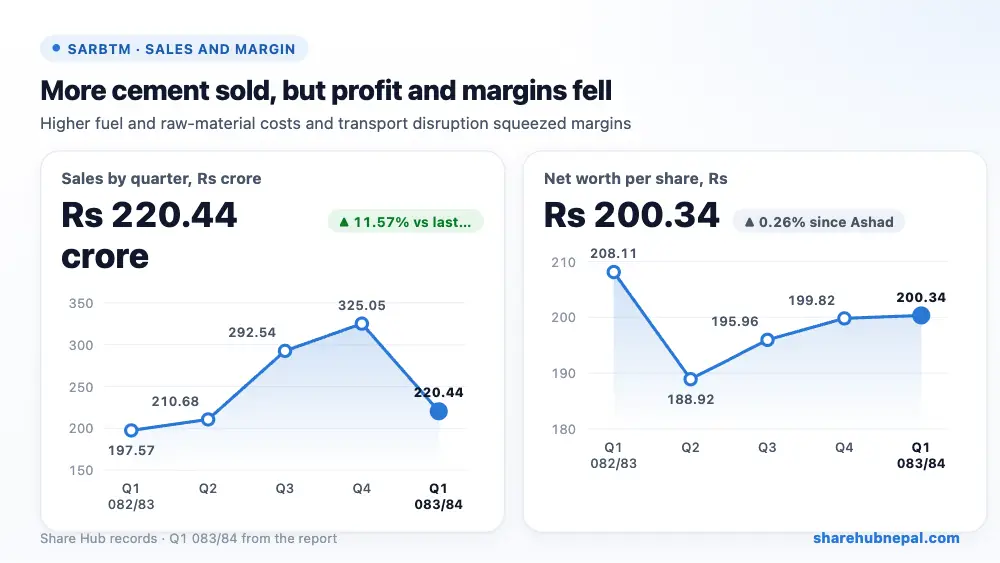
Sarbottam Cement earned Rs 10.39 crore in the first quarter, down 67.95% from Rs 32.43 crore a year ago. Sales grew 11.57% to Rs 220.44 crore, but cost of sales rose 40.66% to Rs 191.74 crore, so gross profit fell 53.15% to Rs 28.70 crore and the gross margin dropped from 31.01% to 13.02%. Management blames higher raw-material and fuel prices (linked to petroleum prices and global tension) and higher transport costs after floods and landslides. Annualised EPS is Rs 7.96 against Rs 26.07.
| Indicator | Q1 2083/84 | Q1 2082/83 | Change |
| Revenue from operations | Rs 2,204,416,079 | Rs 1,975,747,186 | +11.57% |
| Cost of sales | Rs 1,917,397,228 | Rs 1,363,116,181 | +40.66% |
| Other income | Rs 65,435,012 | Rs 54,505,092 | +20.05% |
| Operating profit | Rs 188,242,494 | Rs 463,024,495 | −59.35% |
| Finance cost | Rs 61,777,545 | Rs 66,124,411 | −6.57% |
| Income tax | Rs 22,524,941 | Rs 72,619,261 | −68.98% |
| Net profit | Rs 103,940,008 | Rs 324,280,823 | −67.95% |
| EPS (annualised) | 7.96 | 26.07 | – |
| Net worth per share | 200.34 | 208.11 | – |
1. Where the profit came from
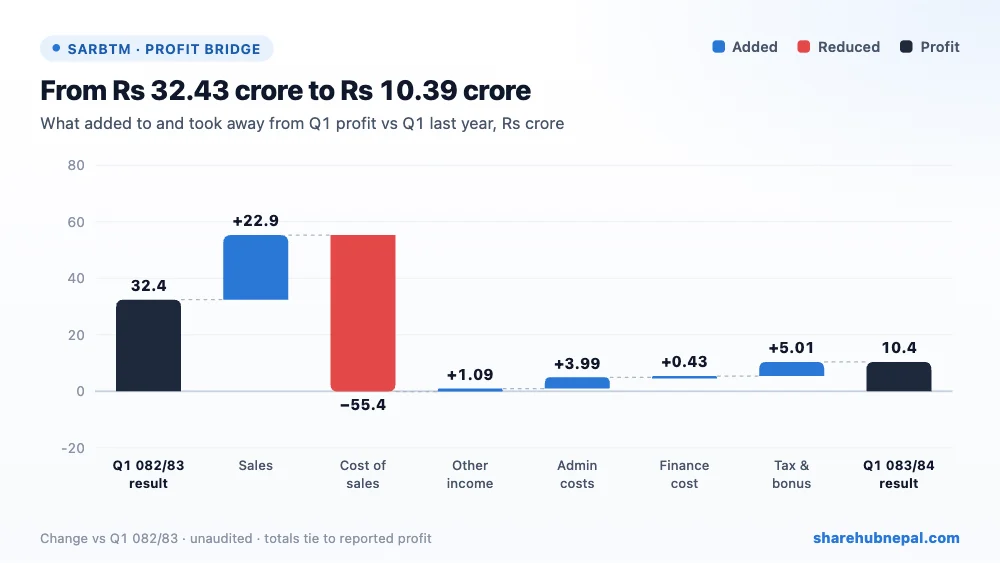
Higher sales added Rs 22.87 crore, but higher cost of sales took away Rs 55.43 crore. Admin cost fell Rs 5.03 crore while selling and distribution rose Rs 1.04 crore (shown together as admin costs, net saving Rs 3.99 crore). Other income added Rs 1.09 crore and finance cost was Rs 43.47 lakh lower. Tax fell by Rs 5.01 crore because profit fell. Cost of sales now takes 87% of every rupee of sales, against 69% a year ago.
2. Profit through the year
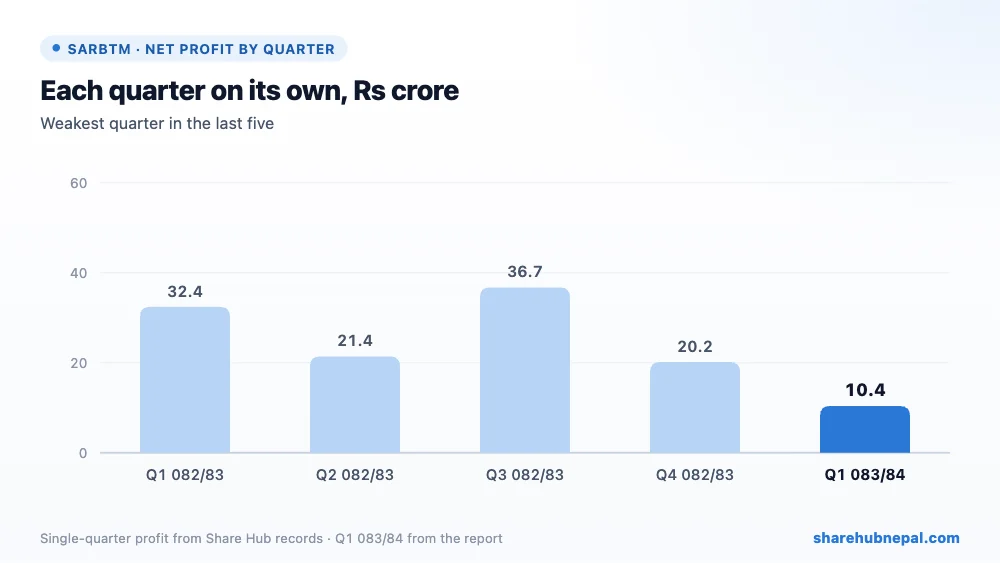
Profit by quarter (Share Hub records): Q1 082/83: Rs 32.43 crore, Q2 082/83: Rs 21.41 crore, Q3 082/83: Rs 36.75 crore, Q4 082/83: Rs 20.16 crore, Q1 083/84: Rs 10.39 crore. FY 2082/83 profit was Rs 110.74 crore (EPS Rs 21.20). Q1 is usually slower for cement because construction slows in the monsoon.
3. Debt and balance sheet
| Particulars | Ashwin 2083 | Ashwin 2082 | Change |
| Total assets | Rs 17,606,320,427 | Rs 15,371,900,830 | +14.54% |
| Total equity | Rs 10,466,145,277 | Rs 10,354,486,598 | +1.08% |
| Long-term borrowings | Rs 0 | Rs 91,720,000 | −100.00% |
| Current borrowings | Rs 4,706,526,338 | Rs 3,894,899,566 | +20.84% |
| Cash and equivalents | Rs 97,336,648 | Rs 52,289,612 | +86.15% |
The report compares the balance sheet with Ashwin 2082, not Ashad 2083. Since then short-term borrowing rose 20.84% to Rs 470.65 crore, trade payables jumped from Rs 12.14 crore to Rs 127.01 crore and inventory rose 33.21% to Rs 258.98 crore; receivables are Rs 376.58 crore. Total assets grew 14.54% to Rs 1,760.63 crore. The long-term loan is fully repaid. Current ratio is 1.11, so working capital is tight.
4. Per-share figures and valuation
| Indicator | Value |
| EPS (annualised) | Rs 7.96 |
| Net worth per share | Rs 200.34 |
| Market price (Ashwin end) | Rs 810 |
| P/E (annualised) | 101.76x |
| P/B | 4.04x |
At the Ashwin-end price of Rs 810, the share trades at 101.76 times annualised EPS and 4.04 times net worth per share. Even on FY 2082/83 EPS of Rs 21.20 the P/E is about 38x.
Conclusion
Positives: sales volume growing, lower admin cost, long-term loan repaid, large investment in group company (Rs 130.50 crore).
Watch: gross margin collapsed to 13%, profit down 68%, rising short-term debt and payables, high inventory and receivables, and a P/E above 100.
Sarbottam is selling more cement but earning much less on it. Profit will recover only if input and transport costs ease or cement prices rise.
Figures are from the company's unaudited Q1 report; quarter trends use Share Hub records. This is not investment advice.

