













Shikhar Power Development Ltd – First Quarter Analysis, FY 2083/84
Unaudited results as on Ashwin end 2083, compared with the same quarter last year (Ashwin end 2082) and with Ashad end 2083.
Summary
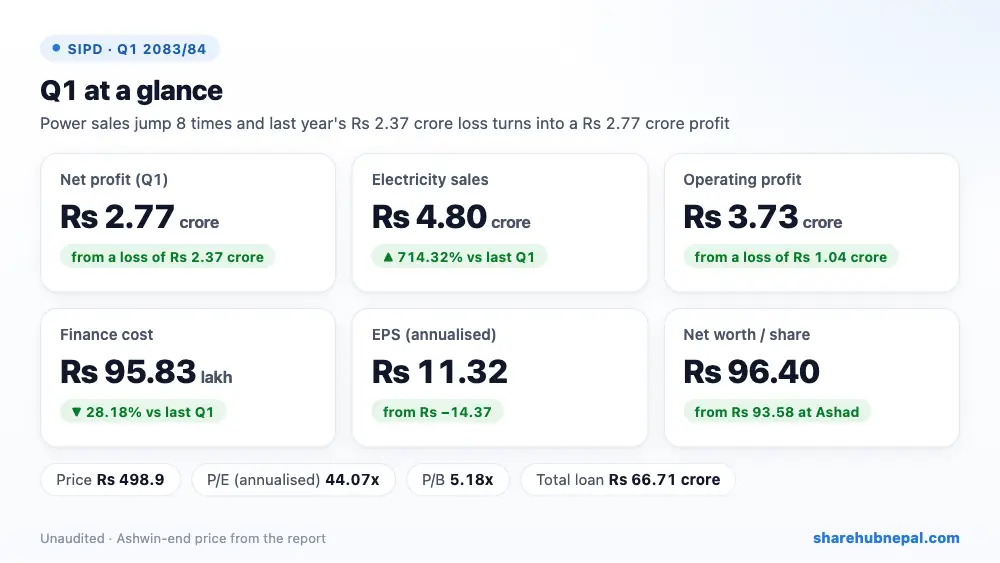
Shikhar Power Development earned a net profit of Rs 2.77 crore in the first quarter of FY 2083/84, against a loss of Rs 2.37 crore a year ago. Electricity sales jumped to Rs 4.80 crore from Rs 58.97 lakh, which is already more than the whole of last year's sales (Rs 3.57 crore). Finance cost fell 28.18% to Rs 95.83 lakh because short-term loans were almost fully repaid, and last year's Rs 32.91 lakh loss on selling shares did not repeat. Quarter EPS is Rs 2.83 (Rs 11.32 annualised) and net worth per share is Rs 96.40, still below the Rs 100 face value because of past losses.
| Indicator | Q1 2083/84 | Q1 2082/83 | Change |
| Revenue from operation | Rs 48,021,557 | Rs 5,897,119 | +714.32% |
| Cost of operation | Rs 1,957,367 | Rs 904,144 | +116.49% |
| Other income + IFRIC-12 revenue | Rs 3,893,110 | Rs 125,096 | +3012.10% |
| Loss on sale of shares | Rs 0 | Rs 3,291,338 | −100.00% |
| Staff and admin expenses | Rs 1,304,767 | Rs 926,619 | +40.81% |
| Depreciation and amortisation | Rs 11,327,910 | Rs 11,270,779 | +0.51% |
| Operating profit | Rs 37,324,624 | −Rs 10,370,665 | Turned to profit |
| Finance cost | Rs 9,582,782 | Rs 13,342,738 | −28.18% |
| Income tax | Rs 0 | Rs 0 | – |
| Net profit | Rs 27,741,842 | −Rs 23,713,402 | Turned to profit |
| EPS (annualised) | 11.32 | -14.37 | – |
| Net worth per share | 96.4 | 99.26 | – |
1. Where the profit came from
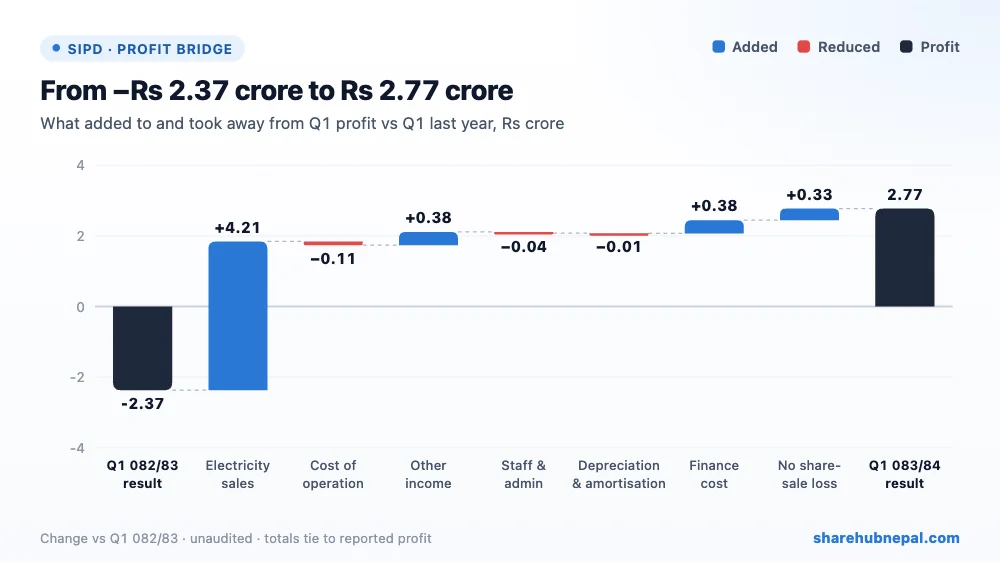
Revenue from operation rose 714.32% to Rs 4.80 crore. Cost of operation was Rs 19.57 lakh, so gross profit was Rs 4.61 crore against Rs 49.93 lakh. Other income (with IFRIC-12 revenue) added Rs 38.93 lakh. Staff and admin costs were small at Rs 13.05 lakh, and depreciation and amortisation stayed at Rs 1.13 crore. Operating profit was Rs 3.73 crore against an operating loss of Rs 1.04 crore. Finance cost of Rs 95.83 lakh took about a quarter of it. No tax, bonus or CSR was provided, so the whole Rs 2.77 crore before tax is net profit.
2. Profit through the year
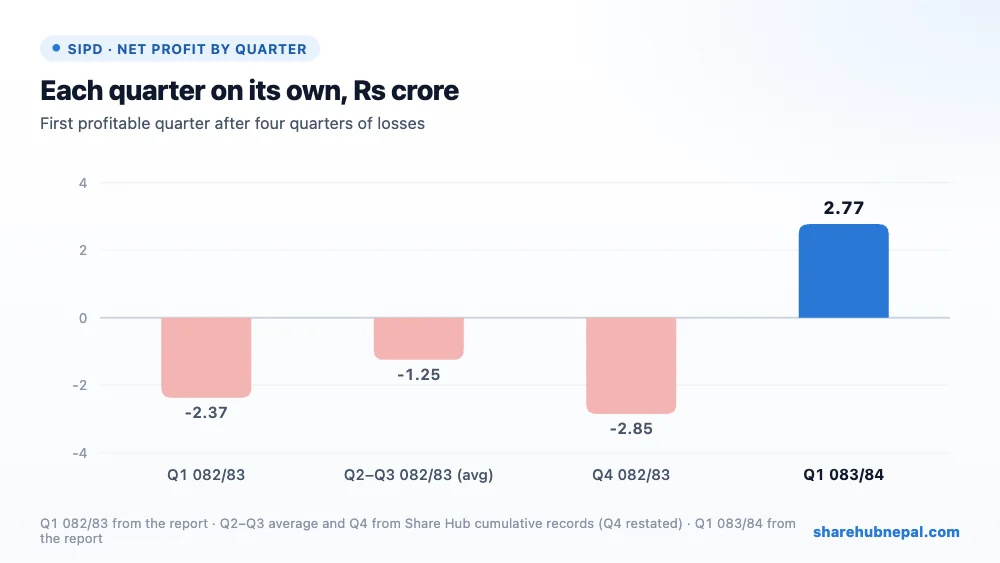
Profit by quarter (Q1 082/83 from this report; Q2–Q4 from Share Hub cumulative records): Q1 082/83: −Rs 2.37 crore, Q2–Q3 082/83 (avg): −Rs 1.25 crore, Q4 082/83: −Rs 2.85 crore, Q1 083/84: Rs 2.77 crore. Every quarter of FY 2082/83 was a loss (full-year restated loss Rs 7.72 crore, EPS Rs −7.87), so this is a clear turnaround. Still, Q1 is the monsoon quarter when run-of-river plants earn the most; the dry-season quarters will be weaker.
3. Debt and balance sheet
| Particulars | Ashwin 2083 | Ashad 2083 | Change |
| Total assets | Rs 1,632,455,592 | Rs 1,609,509,591 | +1.43% |
| Total equity | Rs 944,758,991 | Rs 917,049,347 | +3.02% |
| Long-term loan | Rs 664,823,432 | Rs 665,173,432 | −0.05% |
| Short-term loan | Rs 2,300,000 | Rs 2,300,000 | +0.00% |
| Investment in shares (equity instruments) | Rs 134,626,335 | Rs 130,856,263 | +2.88% |
| Investment in subsidiary | Rs 24,000,000 | Rs 24,000,000 | +0.00% |
| Cash and equivalents | Rs 90,704,884 | Rs 80,914,346 | +12.10% |
| Current assets | Rs 262,259,449 | Rs 229,949,097 | +14.05% |
| Current liabilities | Rs 20,999,352 | Rs 25,168,507 | −16.56% |
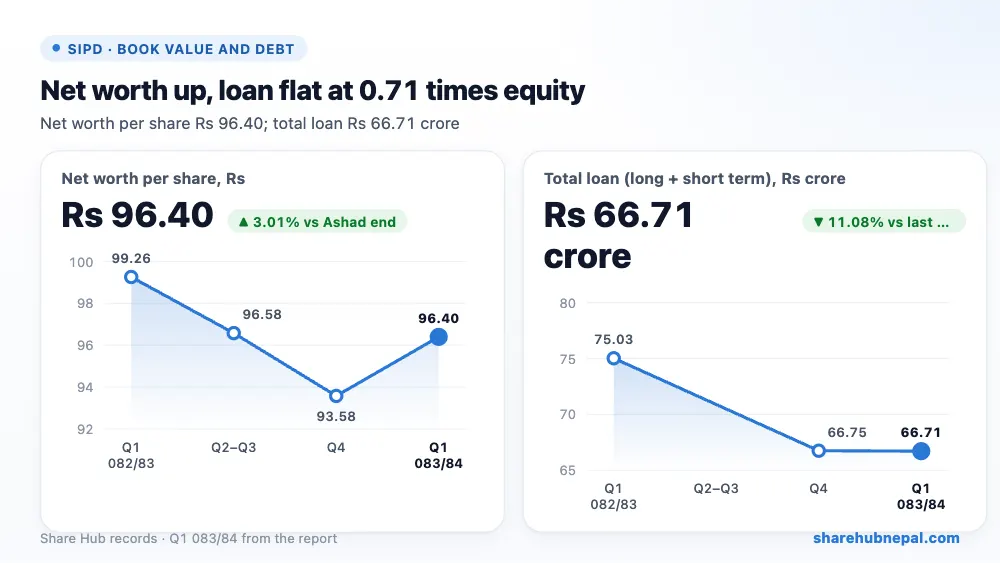
The balance sheet is much safer than a year ago. Short-term loans are only Rs 23 lakh (Rs 8.43 crore a year ago) and the long-term loan is Rs 66.48 crore, so total debt is about 0.71 times equity. Cash rose to Rs 9.07 crore and the liquidity ratio is 12.49. Paid-up capital grew to Rs 98 crore from Rs 66 crore during last year. One thing to note: the company holds Rs 13.46 crore of listed shares as a current investment, and last year it lost Rs 32.91 lakh selling shares, so share-market swings can move its profit. Equity rose 3.02% to Rs 94.48 crore, but other equity is still a negative Rs 3.52 crore.
4. Per-share figures and valuation
| Indicator | Value |
| EPS (annualised) | Rs 11.32 |
| Net worth per share | Rs 96.40 |
| Market price (Ashwin end) | Rs 498.9 |
| P/E (annualised) | 44.07x |
| P/B | 5.18x |
At the Ashwin-end price of Rs 498.9, the share trades at 44.07 times annualised EPS and 5.18 times net worth per share. This P/E uses the best (monsoon) quarter times four, while last year's full-year EPS was negative, and the price is about 5.2 times book value. The market is pricing in a lasting recovery.
Conclusion
Positives: a profit of Rs 2.77 crore against a loss, power sales already above last year's full-year total, short-term loans almost cleared, finance cost down 28.18%, cash of Rs 9.07 crore, and no legal cases.
Watch: profit is seasonal (monsoon quarter), the report does not explain why last year's sales were so low, net worth per share is still below Rs 100 because of past losses, Rs 13.46 crore is tied up in listed shares, the price is high at about 44 times annualised EPS, and the Ashad figures were restated (Share Hub's Q4 record shows the older numbers).
Watch the dry-season Q2 and Q3 profit, whether sales stay well above last year, and how the share investments perform.
Figures are from the company's unaudited Q1 report; quarter trends use Share Hub records. This is not investment advice.

