













Sanjen Jalavidhyut Company Limited – First Quarter Analysis, FY 2083/84
Unaudited results as on Ashwin end 2083, compared with the same quarter last year (Ashwin end 2082) and with Ashad end 2083.
Summary
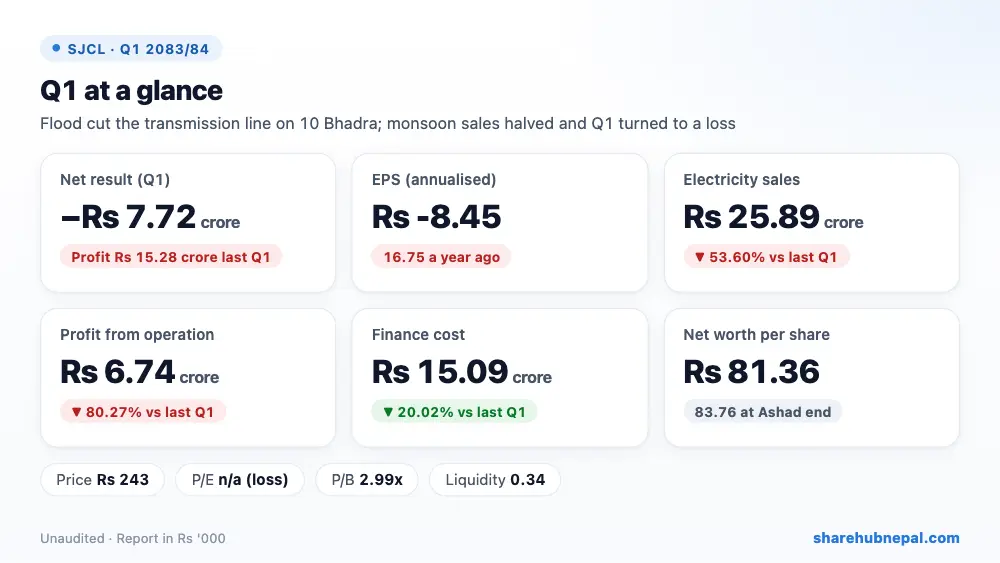
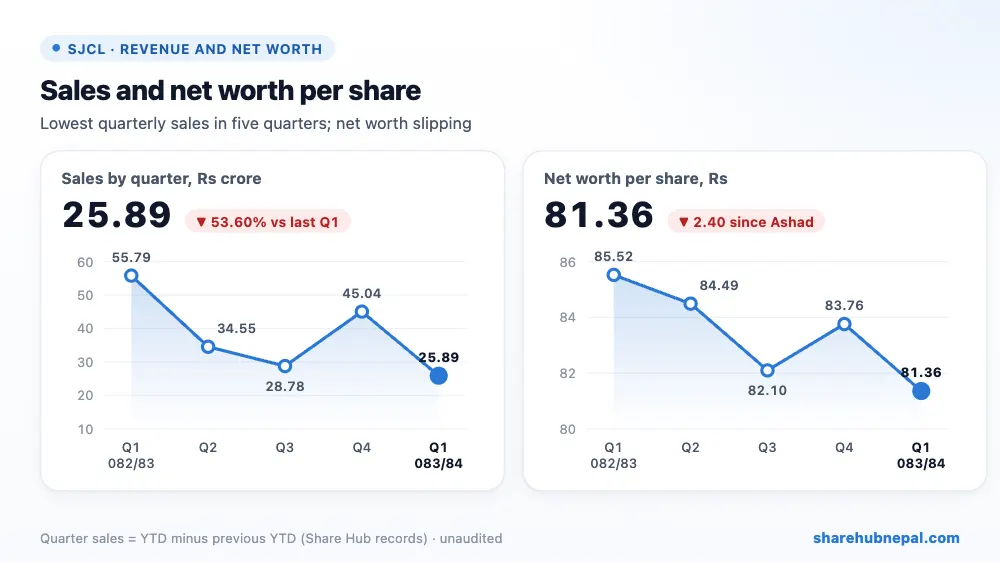
Sanjen Jalavidhyut posted a net loss of Rs 7.72 crore in the first quarter of 2083/84, against a profit of Rs 15.28 crore in the same quarter last year. Quarter EPS is Rs (2.11), or Rs -8.45 annualised, and net worth per share slipped to Rs 81.36 from Rs 83.76 at Ashad end.
The reason is the Bhotekoshi flood of 10 Bhadra 2083. It damaged the Chilime–Trishuli–Matatirtha 220 kV transmission line that carries power from both Sanjen plants, so generation for NEA stopped from that day. The company sold power normally only for about 40 days of the quarter, and electricity sales fell 53.60% to Rs 25.89 crore. Depreciation (Rs 14.39 crore) and interest (Rs 15.09 crore) do not stop when the plant stops, so the quarter ended in a loss. One unit is now running in isolation mode to supply Dhunche and nearby areas of Rasuwa.
| Indicator | Q1 2083/84 | Q1 2082/83 | Change |
| Electricity sales (both plants) | Rs 258,883,040 | Rs 557,938,680 | −53.60% |
| Direct costs | Rs 33,312,970 | Rs 41,889,280 | −20.47% |
| Royalty | Rs 5,941,480 | Rs 13,333,150 | −55.44% |
| Gross profit | Rs 219,628,590 | Rs 502,716,250 | −56.31% |
| Employee and administrative expenses | Rs 8,307,630 | Rs 14,062,030 | −40.92% |
| Depreciation and amortisation | Rs 143,880,630 | Rs 146,816,970 | −2.00% |
| Profit from operation | Rs 67,440,330 | Rs 341,837,250 | −80.27% |
| Other income, finance income and FX gain | Rs 6,306,190 | Rs 2,788,580 | +126.14% |
| Finance cost | Rs 150,896,880 | Rs 188,669,890 | −20.02% |
| Net profit / (loss) | −Rs 77,150,360 | Rs 152,836,820 | Turned to loss |
| EPS (annualised) | -8.45 | 16.75 | – |
1. Where the profit came from
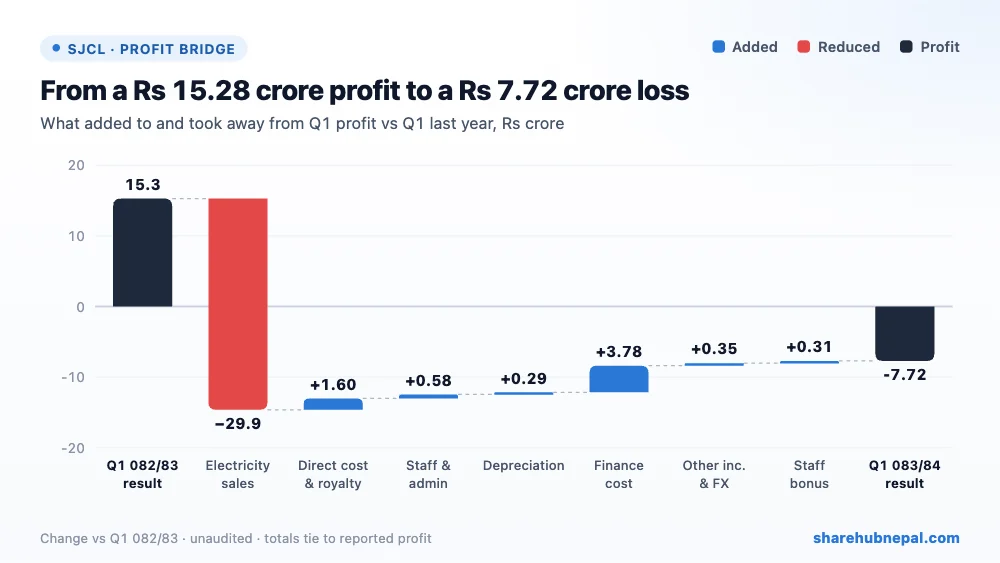
Compared with last year's Q1, lower electricity sales took away Rs 29.91 crore. Savings helped only a little: lower interest added Rs 3.78 crore, lower direct cost and royalty Rs 1.60 crore, lower staff and admin cost Rs 57.54 lakh, higher other income and exchange gain Rs 35.18 lakh, no staff bonus Rs 31.19 lakh and lower depreciation Rs 29.36 lakh. The net change is Rs 23.00 crore, from a Rs 15.28 crore profit to a Rs 7.72 crore loss.
2. Profit through the year
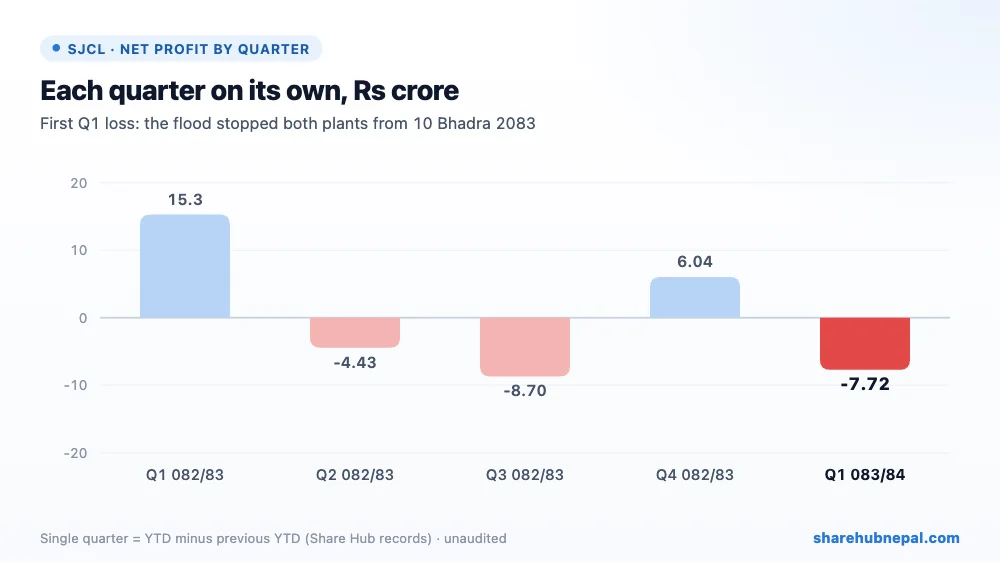
Based on Share Hub's records, single-quarter results in 2082/83 were a profit of Rs 15.28 crore in Q1, losses of Rs 4.43 crore in Q2 and Rs 8.70 crore in Q3, and a profit of Rs 6.04 crore in Q4; FY 2082/83 profit was only Rs 8.20 crore (EPS 2.25). Sanjen depends on the monsoon quarter to cover the dry-season losses. Losing most of this monsoon means FY 2083/84 is likely to be a loss unless the line is repaired quickly and the insurance claim is paid.
3. Debt and balance sheet
| Particulars | Ashwin 2083 | Ashad 2083 | Change |
| Property, plant and equipment | Rs 12,075,530,540 | Rs 12,154,709,700 | −0.65% |
| Trade receivables | Rs 55,468,330 | Rs 339,981,100 | −83.68% |
| Bank balances | Rs 70,067,080 | Rs 13,783,550 | +408.34% |
| Long-term borrowings | Rs 8,268,863,660 | Rs 8,441,155,480 | −2.04% |
| Short-term borrowings | Rs 915,000,000 | Rs 975,000,000 | −6.15% |
| Total equity | Rs 2,969,819,080 | Rs 3,057,191,100 | −2.86% |
| Total assets | Rs 12,412,982,000 | Rs 12,720,270,820 | −2.42% |
Total borrowings are Rs 9.18 arba (long-term Rs 8.27 arba and short-term Rs 91.50 crore) against equity of Rs 2.97 arba, about 3.1 times. Accumulated losses grew to Rs 68.02 crore. Trade receivables fell from Rs 34.00 crore to Rs 5.55 crore as NEA paid its dues, which lifted bank balance to Rs 7.01 crore and let the company pay the seventh Employees Provident Fund loan instalment by Ashwin end. But the liquidity ratio is only 0.34, so short-term payments depend on loans rolling over. Equity fell Rs 1.02 crore more than the Q1 loss, which the report does not explain.
4. Per-share figures and valuation
| Indicator | Value |
| EPS (quarter, as printed) | Rs (2.11) |
| EPS (annualised) | Rs -8.45 |
| Net worth per share | Rs 81.36 |
| Total assets per share | Rs 340.08 |
| Market price (Q1 close) | Rs 243 |
| P/E | n/a (loss) |
| P/B | 2.99x |
| Liquidity ratio | 0.34 |
The Q1 closing price was Rs 243 (range Rs 227 to Rs 285.30). With a loss there is no meaningful P/E; on last year's full-year EPS of Rs 2.25 it was already over 100 times. The price is 2.99 times net worth per share. At this price the market is looking past this year to normal generation once the line is fixed, so the timing of the repair and the insurance payout matter most.
Conclusion
Positives: NEA cleared most of the receivables, bank balance went up, interest cost fell 20% as loans are repaid on schedule, one unit is supplying local load in isolation mode, and the plants themselves were not reported as damaged — the problem is the transmission line.
Watch: when the Chilime–Trishuli 220 kV line will be repaired, whether lost generation is covered by insurance, more quarterly losses while generation is stopped, loans of about 3.1 times equity and a liquidity ratio of 0.34, the arbitration (via NEPCA) over Lot-2 civil contract payments, river-flow and landslide risk in a Himalayan district, and the unexplained Rs 1.02 crore fall in equity.
A bad quarter caused by an outside event: the plants work, but the line that carries their power was cut by the flood. Until it is repaired, Sanjen will keep losing money each quarter, so investors should track the repair date and the insurance claim closely.
Figures are from the company's unaudited Q1 report; quarter trends use Share Hub records. This is not investment advice.

