













Sonapur Minerals and Oil Limited – First Quarter Analysis, FY 2083/84
Unaudited results as on Ashwin end 2083, compared with the same quarter last year (Ashwin end 2082).
Summary
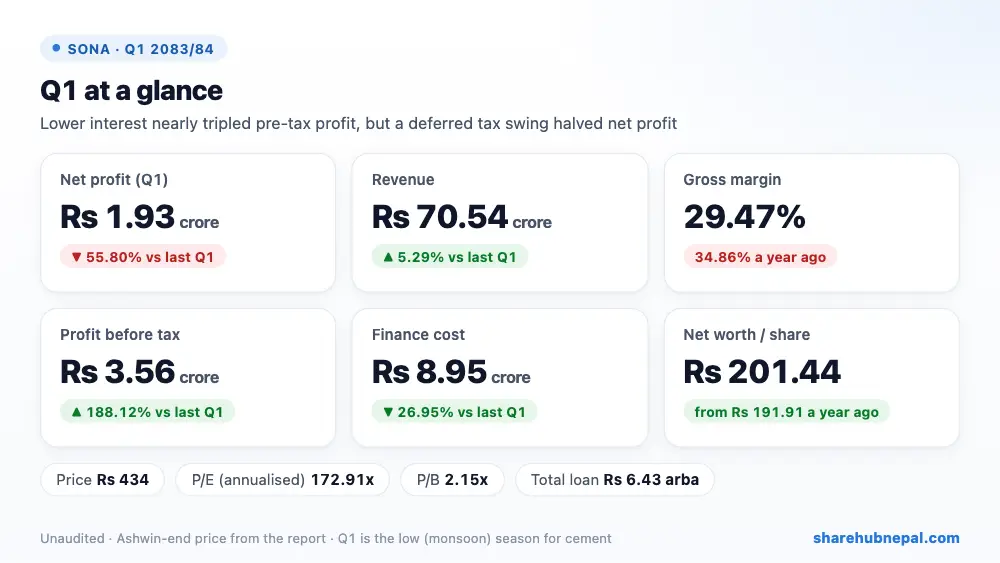
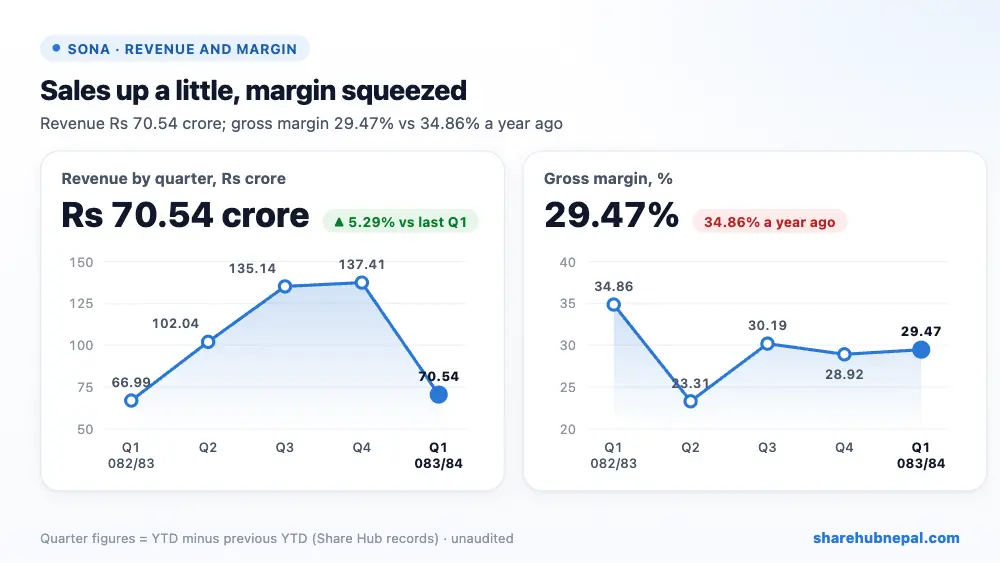
Sonapur Minerals and Oil, a cement maker in Dang, earned a net profit of Rs 1.93 crore in the first quarter of FY 2083/84, down 55.80% from Rs 4.37 crore a year ago. Quarter EPS is Rs 0.63 (Rs 2.51 annualised).,Revenue rose 5.29% to Rs 70.54 crore, but cost of sales rose 14.01%, so gross profit fell 10.99% to Rs 20.79 crore and the gross margin slipped to 29.47% from 34.86%; the company blames high fuel, coal and power costs and weak demand. Lower depreciation (−28.37%) kept operating profit close to last year at Rs 12.51 crore. The big help was interest: finance cost fell 26.95% to Rs 8.95 crore, so profit before tax nearly tripled to Rs 3.56 crore. But tax turned the result around: last year a deferred tax credit of Rs 3.13 crore was added to profit, this year Rs 1.63 crore of tax (mostly deferred) was taken out.
| Indicator | Q1 2083/84 | Q1 2082/83 | Change |
| Revenue from operations | Rs 705,382,151 | Rs 669,921,545 | +5.29% |
| Cost of sales | Rs 497,531,968 | Rs 436,395,702 | +14.01% |
| Gross profit | Rs 207,850,183 | Rs 233,525,843 | −10.99% |
| Other income | Rs 1,924,359 | Rs 1,150,258 | +67.30% |
| Selling and distribution | Rs 5,531,885 | Rs 4,945,454 | +11.86% |
| Administrative expenses | Rs 39,951,458 | Rs 40,184,138 | −0.58% |
| Depreciation and amortisation | Rs 39,163,896 | Rs 54,675,312 | −28.37% |
| Operating profit | Rs 125,127,303 | Rs 134,871,197 | −7.22% |
| Finance costs | Rs 89,489,743 | Rs 122,502,170 | −26.95% |
| Profit before tax | Rs 35,637,560 | Rs 12,369,027 | +188.12% |
| Income tax (incl. deferred) | Rs 16,326,734 | −Rs 31,319,312 | Turned to profit |
| Net profit | Rs 19,310,826 | Rs 43,688,339 | −55.80% |
| EPS (quarter) | 0.63 | 1.42 | – |
1. Where the profit came from
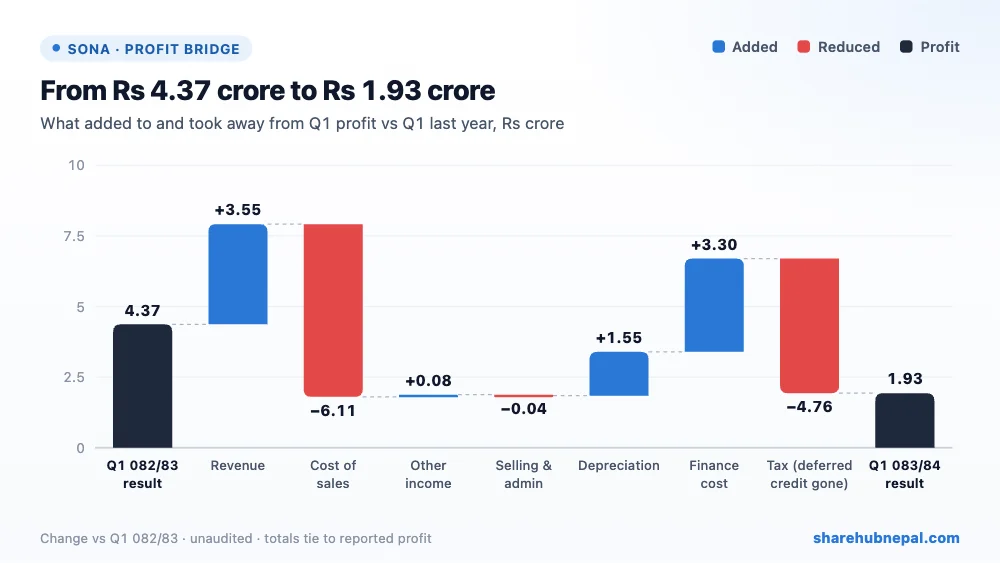
Gross profit fell by Rs 2.57 crore because cost of sales grew faster than sales. Selling and admin costs were almost flat at Rs 4.55 crore, while depreciation fell by Rs 1.55 crore. Finance cost fell by Rs 3.30 crore, the biggest single gain. Without the deferred tax swing (a Rs 3.13 crore credit last year against a Rs 1.49 crore charge now), profit would have been well above last year.
2. Profit through the year
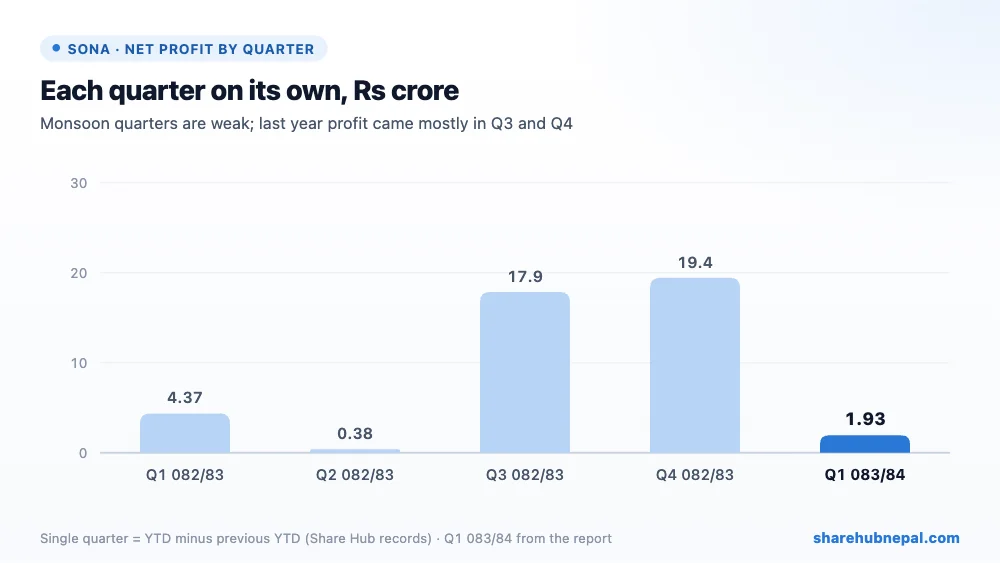
Cement sales follow the construction season: last year Q1 earned Rs 4.37 crore, Q2 only Rs 38.15 lakh, then Q3 Rs 17.86 crore and Q4 Rs 19.44 crore, for a full-year EPS of Rs 10.96. So a weak Q1 is normal, and annualised Q1 EPS understates the year.
3. Debt and balance sheet
| Particulars | Ashwin 2083 | Ashwin 2082 | Change |
| Property, plant and equipment | Rs 10,727,317,513 | Rs 10,027,660,809 | +6.98% |
| Inventories | Rs 2,799,804,366 | Rs 2,756,735,953 | +1.56% |
| Trade receivables | Rs 697,862,923 | Rs 925,047,019 | −24.56% |
| Loans and advances | Rs 413,213,495 | Rs 200,626,729 | +105.96% |
| Cash and cash equivalents | Rs 48,057,012 | Rs 104,073,081 | −53.82% |
| Borrowings (non-current + current) | Rs 6,432,578,210 | Rs 6,525,754,231 | −1.43% |
| Total equity | Rs 6,194,208,601 | Rs 5,901,336,273 | +4.96% |
Debt is large: total borrowings are Rs 6.43 arba (Rs 5.60 arba long-term and Rs 83.45 crore current), about 1.04 times equity, though slightly lower than a year ago. Trade receivables fell 24.56% to Rs 69.79 crore, but loans and advances doubled to Rs 41.32 crore and other financial liabilities rose to Rs 1.53 arba. Cash is low at Rs 4.81 crore. The company has a Supreme Court case against NEA over a Rs 24.30 crore dedicated and trunk line electricity bill, and has sued 13 customers for Rs 2.76 crore of dues.
4. Per-share figures and valuation
| Indicator | Value |
| EPS (quarter, report) | Rs 0.63 |
| EPS (annualised, derived) | Rs 2.51 |
| Net worth per share (report) | Rs 201.44 |
| Market price (Ashwin end) | Rs 434 |
| P/E (annualised) | 172.91x |
| P/B | 2.15x |
| Liquidity ratio (report) | 1.41 |
At Rs 434 the share trades at 2.15 times net worth per share. The annualised P/E of about 173 is not useful because Q1 is the off-season; on last year's EPS of Rs 10.96 the P/E is about 40.
Conclusion
Positives: revenue up 5.29%, finance cost down 26.95%, profit before tax nearly tripled, receivables lower, and plans for a cement silo, kiln upgrade, solar plant and new construction-chemical products.
Watch: net profit down 55.80% on the deferred tax swing, gross margin down to 29.47%, debt of Rs 6.43 arba with finance cost still taking most of operating profit, a Rs 24.30 crore power-bill dispute with NEA, and loans and advances doubled without explanation.
Watch Q2–Q3 sales as the construction season starts, the gross margin, the NEA court case and further debt reduction.
Figures are from the company's unaudited Q1 report; quarter trends use Share Hub records. This is not investment advice.

