













SY Panel Nepal Limited – First Quarter Analysis, FY 2083/84
Unaudited results as on Ashwin end 2083, compared with the same quarter last year (Ashwin end 2082) and with Ashad end 2083.
Summary
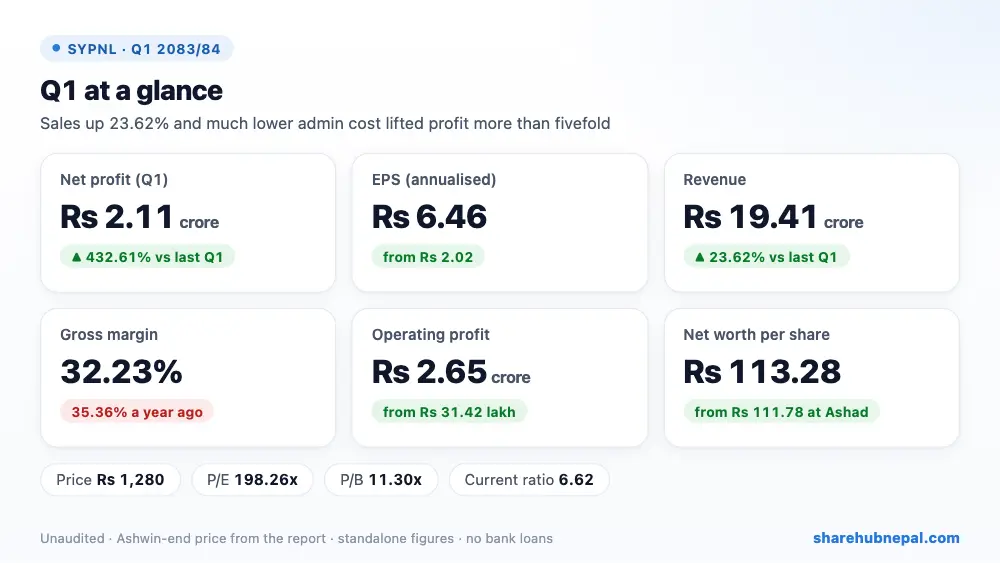
SY Panel Nepal, which makes prefabricated panels and building materials, earned a net profit of Rs 2.11 crore in the first quarter of FY 2083/84, more than five times the Rs 39.64 lakh of a year ago (+432.61%). Annualised EPS is Rs 6.46, against Rs 2.02 last year.
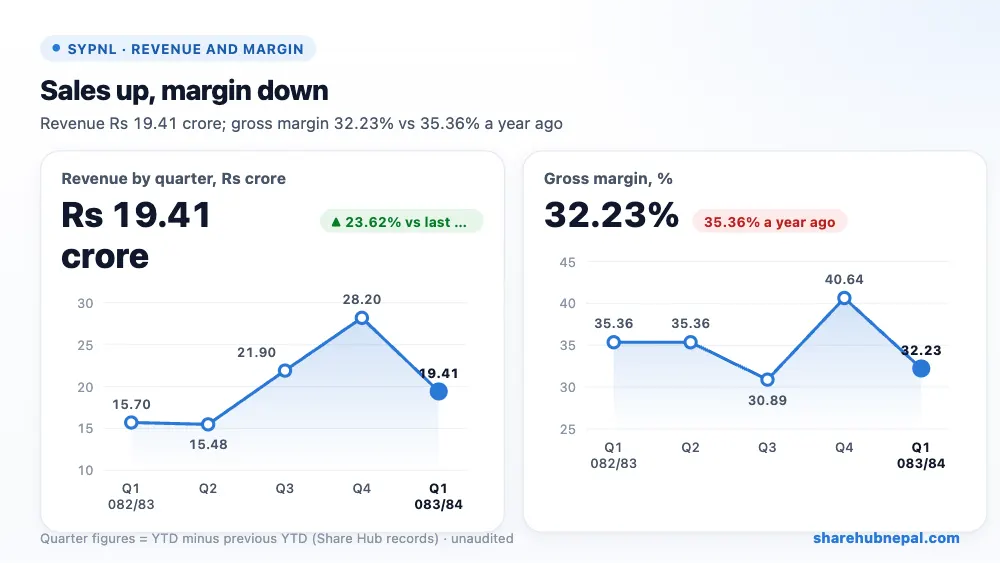
Revenue rose 23.62% to Rs 19.41 crore, but cost of sales rose faster (29.60%), so gross profit grew only 12.69% to Rs 6.26 crore and the gross margin fell to 32.23% from 35.36%; the company says raw material prices rose because of war and natural disasters. The big jump in profit came from much lower overheads: administrative expenses fell 64.70% (from Rs 2.31 crore to Rs 81.53 lakh, not explained in the report) and selling cost fell 29.64%. A foreign exchange gain of Rs 23.01 lakh also helped. Operating profit rose to Rs 2.65 crore from Rs 31.42 lakh.
| Indicator | Q1 2083/84 | Q1 2082/83 | Change |
| Revenue from operations | Rs 194,123,032 | Rs 157,028,336 | +23.62% |
| Cost of sales | Rs 131,557,336 | Rs 101,508,818 | +29.60% |
| Gross profit | Rs 62,565,696 | Rs 55,519,517 | +12.69% |
| Employee expenses | Rs 13,412,263 | Rs 11,505,541 | +16.57% |
| Administrative expenses | Rs 8,153,024 | Rs 23,096,664 | −64.70% |
| Selling and distribution | Rs 8,644,435 | Rs 12,286,112 | −29.64% |
| Depreciation and amortisation | Rs 6,264,215 | Rs 5,831,319 | +7.42% |
| Operating profit | Rs 26,488,582 | Rs 3,142,145 | +743.01% |
| Other income, finance income and FX gain | Rs 2,891,649 | Rs 571,268 | +406.18% |
| Staff bonus | Rs 2,633,544 | Rs 302,496 | +770.60% |
| Income tax | Rs 5,221,170 | −Rs 939,336 | Turned to profit |
| Net profit | Rs 21,114,268 | Rs 3,964,291 | +432.61% |
| EPS (annualised) | 6.46 | 2.02 | – |
1. Where the profit came from
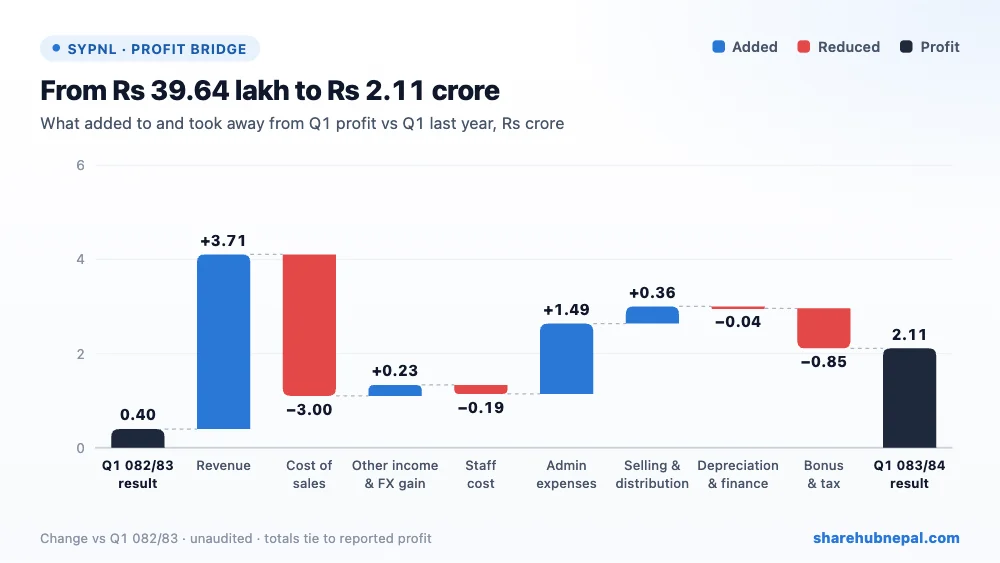
Compared with last year's Q1, higher revenue added Rs 3.71 crore but higher cost of sales took away Rs 3.00 crore. Lower admin cost added Rs 1.49 crore, lower selling cost Rs 36.42 lakh and higher other income with the FX gain Rs 23.20 lakh. Staff cost took away Rs 19.07 lakh, depreciation and finance cost Rs 4.04 lakh, and staff bonus and tax Rs 84.92 lakh (last year had a small tax credit). Net result: Rs 1.71 crore more profit.
2. Profit through the year
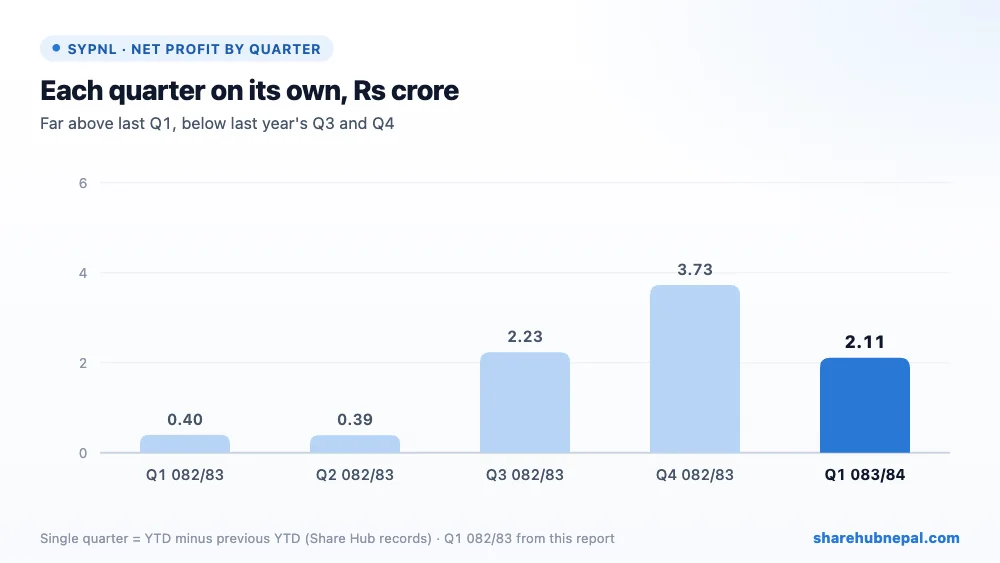
Based on Share Hub's records (Q1 082/83 from this report), single-quarter profit in 2082/83 was Rs 39.64 lakh in Q1, Rs 39.07 lakh in Q2, Rs 2.23 crore in Q3 and Rs 3.73 crore in Q4, for a full-year profit of Rs 6.75 crore (EPS Rs 6.28). This Q1 is far better than the first half of last year, though below the last two quarters, when sales were higher (Rs 21.90 crore and Rs 28.20 crore).
3. Debt and balance sheet
| Particulars | Ashwin 2083 | Ashad 2083 | Change |
| Property, plant and equipment | Rs 646,850,857 | Rs 562,799,029 | +14.93% |
| Investments (mainly subsidiary) | Rs 432,500,000 | Rs 432,500,000 | +0.00% |
| Inventories | Rs 196,365,258 | Rs 154,086,172 | +27.44% |
| Trade receivables | Rs 172,677,169 | Rs 160,984,635 | +7.26% |
| Cash and cash equivalents | Rs 296,751,146 | Rs 322,850,706 | −8.08% |
| Trade payables (current + non-current) | Rs 249,180,511 | Rs 216,946,332 | +14.86% |
| Total equity | Rs 1,481,861,595 | Rs 1,462,285,342 | +1.34% |
The company has no bank loans and Rs 29.68 crore in cash, and current assets are 6.62 times current liabilities. Rs 39 crore of its IPO money is invested in the subsidiary S.Y. U.P.V.C Profile, whose uPVC profile plant is in its final stage before starting; SY Panel also sold Rs 1.64 crore of goods to this subsidiary in the quarter. Property, plant and equipment rose by Rs 8.41 crore and inventories by 27.44% to Rs 19.64 crore. Note that Rs 16.10 crore of trade payables is shown as a non-current liability, which is unusual. Equity rose to Rs 1.48 arba, Rs 15.38 lakh less than the Q1 profit (not explained).
4. Per-share figures and valuation
| Indicator | Value |
| EPS (annualised, report) | Rs 6.46 |
| Net worth per share (derived) | Rs 113.28 |
| Market price (Ashwin end) | Rs 1,280 |
| P/E (report) | 198.26x |
| P/B | 11.30x |
| ROE (report) | 5.78% |
| Current ratio | 6.62 |
At the Ashwin-end price of Rs 1,280 the share trades at 198.26 times annualised EPS and 11.30 times net worth per share. On last year's full-year EPS of Rs 6.28 the P/E is about 204. These are very high multiples; the price is betting on the uPVC subsidiary and future growth rather than current earnings.
Conclusion
Positives: profit up 432.61%, revenue up 23.62%, admin and selling costs sharply lower, no bank debt, strong liquidity (current ratio 6.62), and a new uPVC profile business close to starting.
Watch: falling gross margin (32.23%) as raw material prices rise, an unexplained 64.70% fall in admin cost, non-current trade payables of Rs 16.10 crore, tax disputes with possible liabilities of Rs 37.76 lakh (customs), Rs 18.12 lakh and Rs 3.86 crore (excise, VAT and penalties), and a very high P/E and P/B.
A much better Q1 than last year, but driven more by lower overheads than by the core margin. Watch whether admin costs stay low, whether the gross margin recovers, the start of the uPVC subsidiary, and the Supreme Court tax cases.
Figures are from the company's unaudited Q1 report; quarter trends use Share Hub records. This is not investment advice.

