













United Ajod Insurance Limited – First Quarter Analysis, FY 2083/84
Unaudited results as on Ashwin end 2083, compared with the same quarter last year (Ashwin end 2082) and with Ashad end 2083.
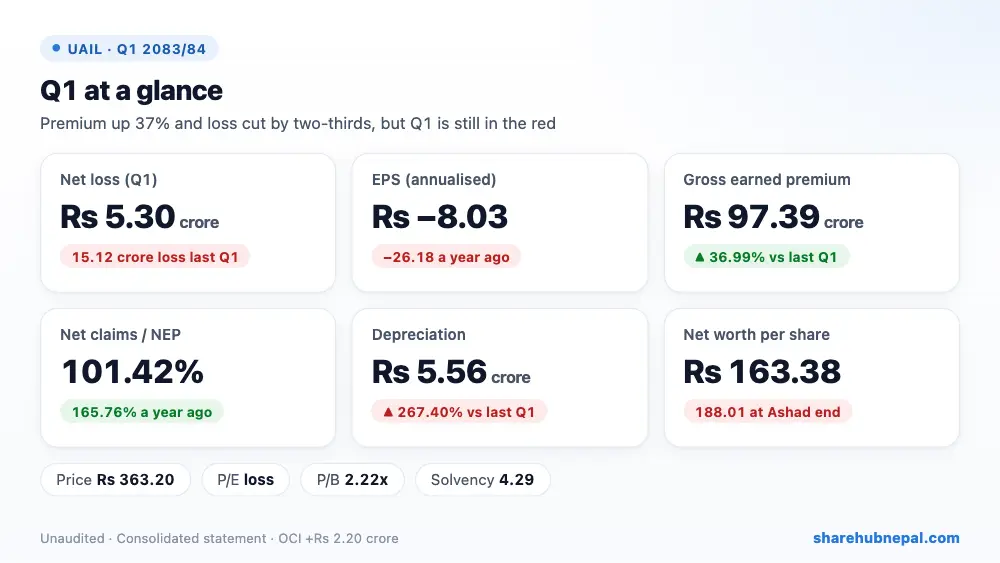
Summary
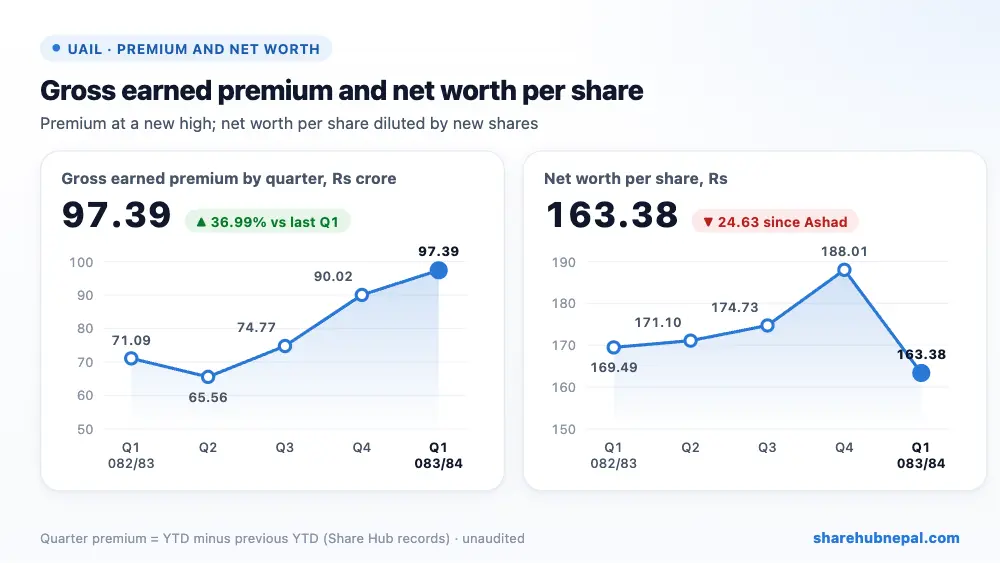
United Ajod Insurance posted a net loss of Rs 5.30 crore in the first quarter of 2083/84, much smaller than the Rs 15.12 crore loss in the same quarter last year. Annualised EPS is Rs −8.03 (Rs −26.18 last year). Net worth per share is Rs 163.38, down from Rs 188.01 at Ashad end mainly because share capital rose to Rs 2.64 arba from Rs 2.31 arba.
The core business improved a lot: gross earned premium rose 36.99% to Rs 97.39 crore, net earned premium rose 41.02% to Rs 34.63 crore, commission from reinsurers rose 63.59%, and net claims fell 13.71% to Rs 35.12 crore. Even so, net claims were still slightly more than net premium (101.42%), and the company says the Rasuwa floods hurt this quarter. Costs also rose: depreciation jumped to Rs 5.56 crore from Rs 1.51 crore, commission and fees nearly doubled, and investment income fell 22.78%. A smaller tax credit than last year also reduced the gain.
| Indicator | Q1 2083/84 | Q1 2082/83 | Change |
| Gross earned premium | Rs 973,910,087 | Rs 710,917,910 | +36.99% |
| Net earned premium | Rs 346,299,739 | Rs 245,558,256 | +41.03% |
| Commission income (from reinsurers) | Rs 114,302,943 | Rs 69,871,548 | +63.59% |
| Investment income | Rs 33,450,065 | Rs 43,316,203 | −22.78% |
| Net claims incurred | Rs 351,221,995 | Rs 407,039,090 | −13.71% |
| Commission, fees and other direct | Rs 31,194,862 | Rs 16,788,169 | +85.81% |
| Staff costs | Rs 93,744,062 | Rs 106,635,726 | −12.09% |
| Depreciation and amortisation | Rs 55,566,981 | Rs 15,124,545 | +267.40% |
| Loss before tax | −Rs 75,692,676 | −Rs 215,990,475 | +64.96% |
| Income tax (credit) | −Rs 22,707,803 | −Rs 64,797,143 | +64.96% |
| Net loss | −Rs 52,984,873 | −Rs 151,193,332 | +64.96% |
| EPS (annualised) | -8.03 | -26.18 | – |
1. Where the profit came from
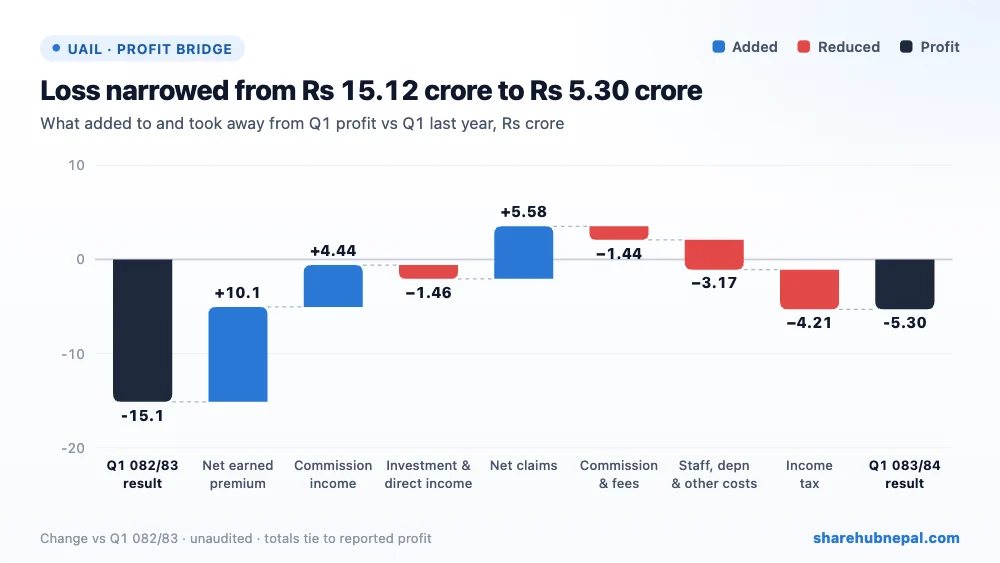
Compared with last year's Q1, higher net earned premium added Rs 10.07 crore, higher commission from reinsurers Rs 4.44 crore and lower net claims Rs 5.58 crore. Against that, lower investment and other direct income took away Rs 1.46 crore, higher commission and fees Rs 1.44 crore, higher staff, depreciation and other costs Rs 3.17 crore, and a smaller tax credit Rs 4.21 crore. The net result is Rs 9.82 crore better — the loss shrank from Rs 15.12 crore to Rs 5.30 crore.
2. Profit through the year
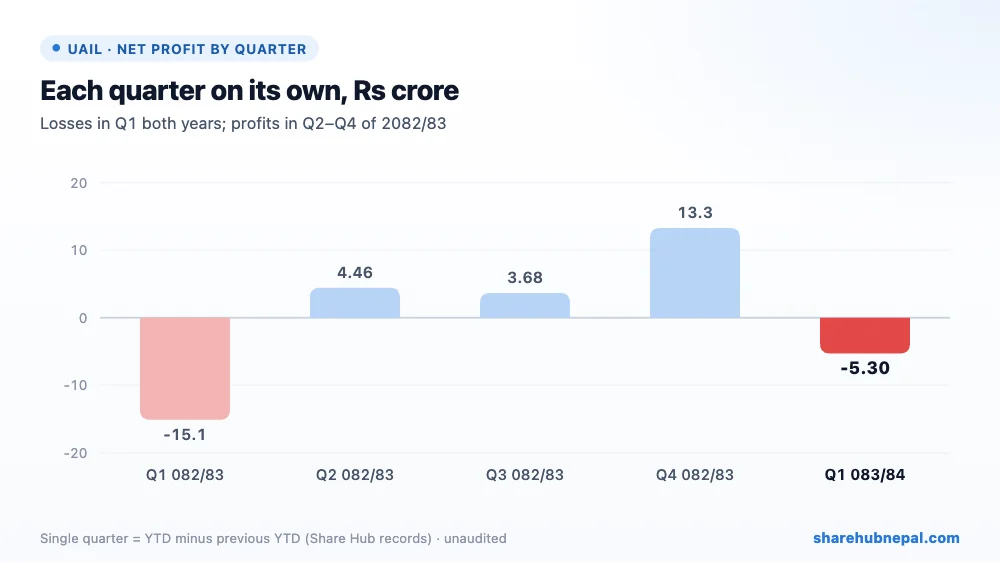
Based on Share Hub's records, single-quarter results in 2082/83 were a loss of Rs 15.12 crore in Q1, then profits of Rs 4.46 crore in Q2, Rs 3.68 crore in Q3 and Rs 13.29 crore in Q4 (full-year profit Rs 6.31 crore). So Q1 was also the weak quarter last year, and the company recovered later in the year. Quarterly premium has risen every quarter since Q2 and is now at its highest.
3. Debt and balance sheet
| Particulars | Ashwin 2083 | Ashad 2083 | Change |
| Investments | Rs 4,582,169,225 | Rs 4,508,874,270 | +1.63% |
| Reinsurance assets | Rs 2,144,446,924 | Rs 2,262,117,114 | −5.20% |
| Cash and cash equivalents | Rs 467,469,046 | Rs 540,658,642 | −13.54% |
| Gross insurance contract liabilities | Rs 3,377,081,770 | Rs 3,590,662,086 | −5.95% |
| Share capital | Rs 2,640,000,000 | Rs 2,310,000,000 | +14.29% |
| Total equity | Rs 4,313,267,440 | Rs 4,343,118,586 | −0.69% |
| Total assets | Rs 8,967,487,748 | Rs 9,053,967,895 | −0.96% |
Total assets are Rs 8.97 arba. Investments are Rs 4.58 arba; long-term investments rose to Rs 1.79 arba from Rs 1.33 arba a year ago while short-term deposits fell to Rs 2.79 arba. Reinsurance assets are Rs 2.14 arba and gross insurance contract liabilities Rs 3.38 arba; gross outstanding claims (incl. IBNR) rose to Rs 2.88 arba from Rs 2.30 arba, but most of it is with reinsurers (net Rs 66.58 crore). Share capital rose to Rs 2.64 arba as the share application money of Rs 22.69 crore was allotted; retained earnings fell Rs 15.72 crore, about Rs 10.42 crore more than the loss, which the report does not explain (likely capitalised). Equity is Rs 4.31 arba and there are no borrowings.
4. Per-share figures and valuation
| Indicator | Value |
| EPS (annualised) | Rs -8.03 |
| Net worth per share | Rs 163.38 |
| Total assets per share | Rs 339.68 |
| Market price (Q1 close) | Rs 363.20 |
| P/E | n/a (loss) |
| P/B | 2.22x |
| Solvency ratio (FY 2081/82) | 4.29 |
The Q1 closing price was Rs 363.20 (range Rs 354.10 to Rs 485). With a loss, P/E is not meaningful (the report prints −45.24); the price is 2.22 times net worth per share. The solvency ratio is 4.29 times (actuarial valuation for FY 2081/82), and the report says there are no pending legal cases.
Conclusion
Positives: premium growth of 37%, net premium up 41%, much higher reinsurance commission, lower net claims, a loss cut by two-thirds, an OCI gain of Rs 2.20 crore, a strong solvency ratio and no borrowings.
Watch: still a loss, net claims above net premium (Rasuwa floods), depreciation up 267% without explanation, investment income down 23%, finance cost up 155%, net worth per share diluted to Rs 163.38, and the unexplained fall in retained earnings.
A much better Q1 than last year: strong premium growth and lower claims cut the loss by two-thirds. The company still needs claims and costs to settle before it can show a profit, as it did in the later quarters of 2082/83.
Figures are from the company's unaudited Q1 report; quarter trends use Share Hub records. This is not investment advice.

