













Unilever Nepal Limited – First Quarter Analysis, FY 2083/84
Unaudited results as on Ashwin end 2083, compared with the same quarter last year (Ashwin end 2082).
Summary
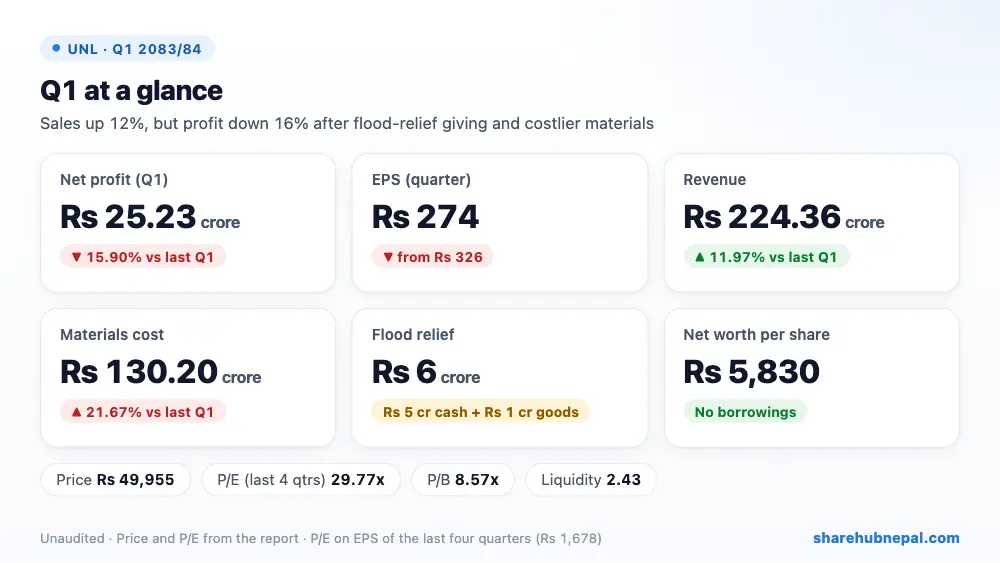
Unilever Nepal earned a net profit of Rs 25.23 crore in the first quarter, down 15.90% from Rs 30.00 crore a year ago. Quarter EPS is Rs 274 against Rs 326.
Sales were strong: revenue rose 11.97% to Rs 224.36 crore, driven by volume and good festive-season execution, with all three business groups growing and Home Care doing best. Two things pulled profit down. First, after the Bhote Koshi flood of 26 August, the company gave Rs 5 crore in cash to the PM Disaster Relief Fund and about Rs 1 crore of hygiene products. Second, the cost of materials rose 21.67%, faster than sales, because of an adverse sales mix and material inflation. The company says that, without the relief contribution, profit would have grown 4%. The tax charge also rose to Rs 8.90 crore.
| Indicator | Q1 2083/84 | Q1 2082/83 | Change |
| Revenue from operations | Rs 2,243,600,000 | Rs 2,003,700,000 | +11.97% |
| Cost of materials consumed | Rs 1,302,000,000 | Rs 1,070,100,000 | +21.67% |
| Employee benefit expenses | Rs 183,800,000 | Rs 175,800,000 | +4.55% |
| Other expenses | Rs 341,300,000 | Rs 322,100,000 | +5.96% |
| Profit before tax | Rs 341,300,000 | Rs 369,700,000 | −7.68% |
| Income tax | Rs 89,000,000 | Rs 69,800,000 | +27.51% |
| Net profit | Rs 252,300,000 | Rs 300,000,000 | −15.90% |
| EPS (quarter) | 274 | 326 | – |
1. Where the profit came from
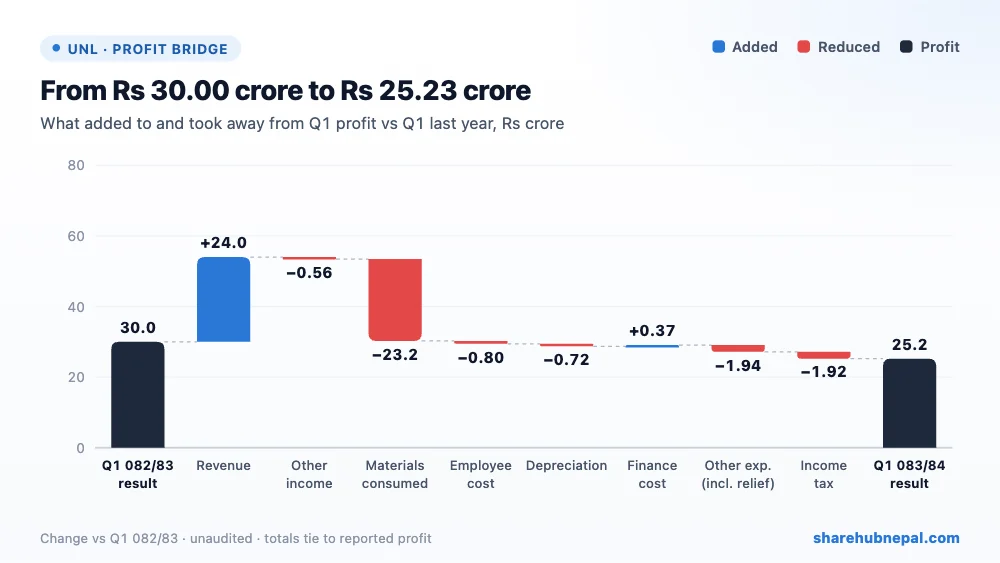
Compared with last year's Q1, higher revenue added Rs 23.99 crore and lower finance cost Rs 37 lakh. Higher material costs took away Rs 23.19 crore, a higher tax charge Rs 1.92 crore, higher other expenses (including the flood relief) Rs 1.94 crore, employee costs Rs 80 lakh, depreciation Rs 72 lakh and lower other income Rs 56 lakh.
2. Profit through the year
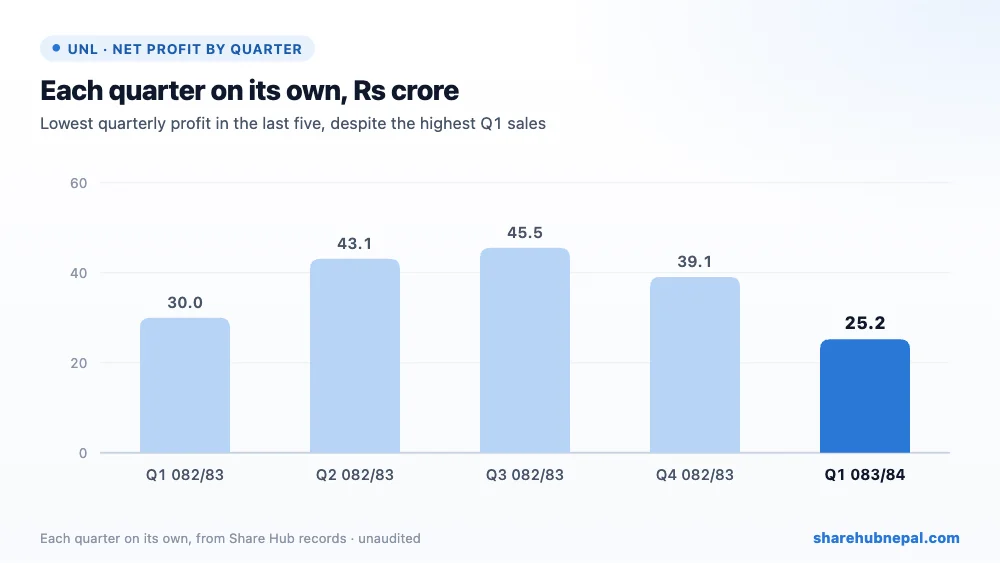
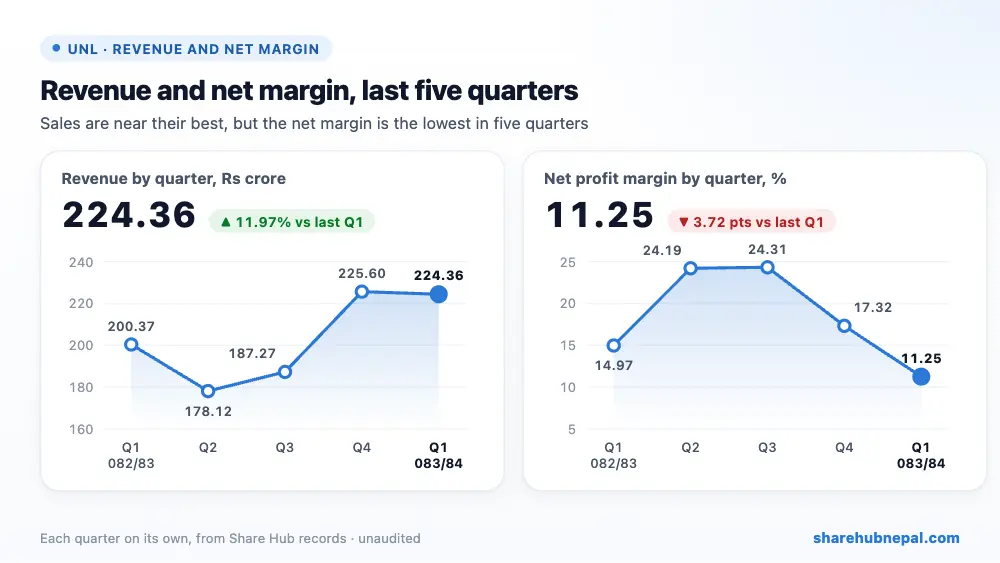
Share Hub's UNL records hold each quarter on its own. Profit in 2082/83 was Rs 30.00 crore in Q1, Rs 43.09 crore in Q2, Rs 45.53 crore in Q3 and Rs 39.08 crore in Q4. This quarter's Rs 25.23 crore is the lowest of the five, and the net margin fell to 11.25% from 14.97%.
3. Debt and balance sheet
| Particulars | Ashwin 2083 | Ashwin 2082 | Change |
| Cash and cash equivalents | Rs 2,498,600,000 | Rs 1,254,900,000 | +99.11% |
| Investments in fixed deposit | Rs 601,100,000 | Rs 2,200,000,000 | −72.68% |
| Inventories | Rs 1,318,200,000 | Rs 1,048,900,000 | +25.67% |
| Trade and other receivables | Rs 1,521,900,000 | Rs 1,610,100,000 | −5.48% |
| Trade and other payables | Rs 2,277,500,000 | Rs 2,182,200,000 | +4.37% |
| Total assets | Rs 8,070,300,000 | Rs 8,229,400,000 | −1.93% |
| Total equity | Rs 5,367,700,000 | Rs 5,527,100,000 | −2.88% |
The report compares the balance sheet with a year ago (Ashwin 2082). The company has no borrowings. Cash rose to Rs 249.86 crore while fixed deposits fell to Rs 60.11 crore from Rs 220 crore, so total cash and deposits were about Rs 310 crore against Rs 345 crore. Inventories rose 25.67% to Rs 131.82 crore. Equity fell 2.88% to Rs 536.77 crore because dividends paid were larger than profit, and net worth per share fell to Rs 5,830 from Rs 6,003.
4. Per-share figures and valuation
| Indicator | Value |
| EPS (quarter) | Rs 274 |
| EPS (last four quarters, report) | Rs 1,678 |
| Net worth per share | Rs 5,830 |
| Market price (report) | Rs 49,955 |
| P/E (report) | 29.77x |
| P/B | 8.57x |
| Liquidity ratio | 2.43 |
At Rs 49,955 the share trades at 29.77 times the EPS of the last four quarters (Rs 1,678) and 8.57 times net worth per share. The premium reflects a debt-free balance sheet and a high payout record, but earnings fell this quarter.
Conclusion
Positives: revenue up 11.97% on volume, growth in all three business groups, no borrowings, large cash and deposits, and a like-for-like profit increase of 4% (company figure).
Watch: profit down 15.90%, material costs up 21.67%, a lower gross margin (41.97% against 46.59%), a higher tax rate, inventories up 25.67%, and a very high P/B (8.57x).
Unilever Nepal is selling more, but cost inflation and the one-off flood-relief contribution cut this quarter's profit. With the relief cost behind it, pricing and cost control will decide whether margins recover.
Figures are from the company's unaudited Q1 report; quarter trends use Share Hub records. This is not investment advice.

