













Upper Tamakoshi Hydropower Limited – First Quarter Analysis, FY 2083/84
Unaudited results as on Ashwin end 2083, compared with the same quarter last year (Ashwin end 2082) and with Ashad end 2083.
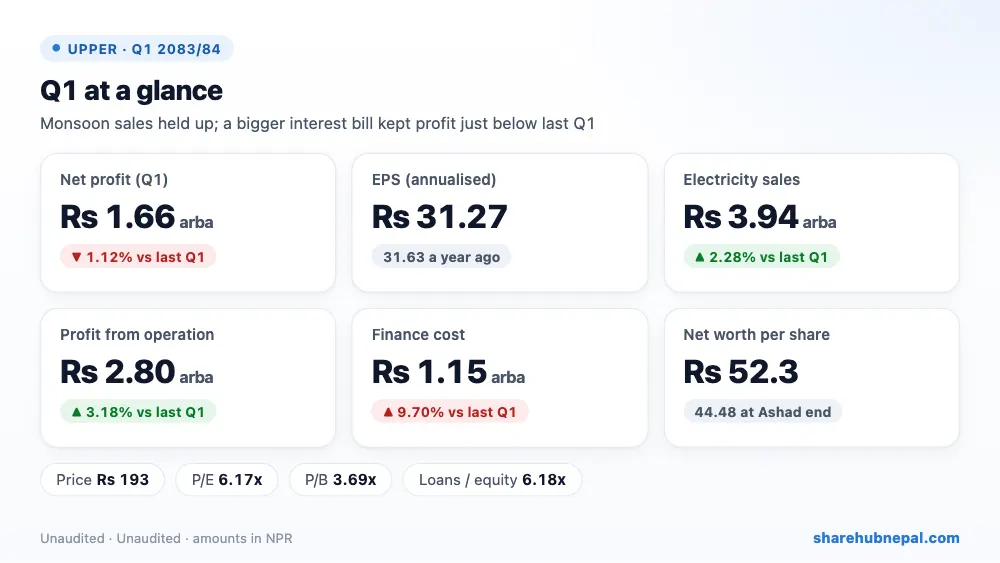
Summary
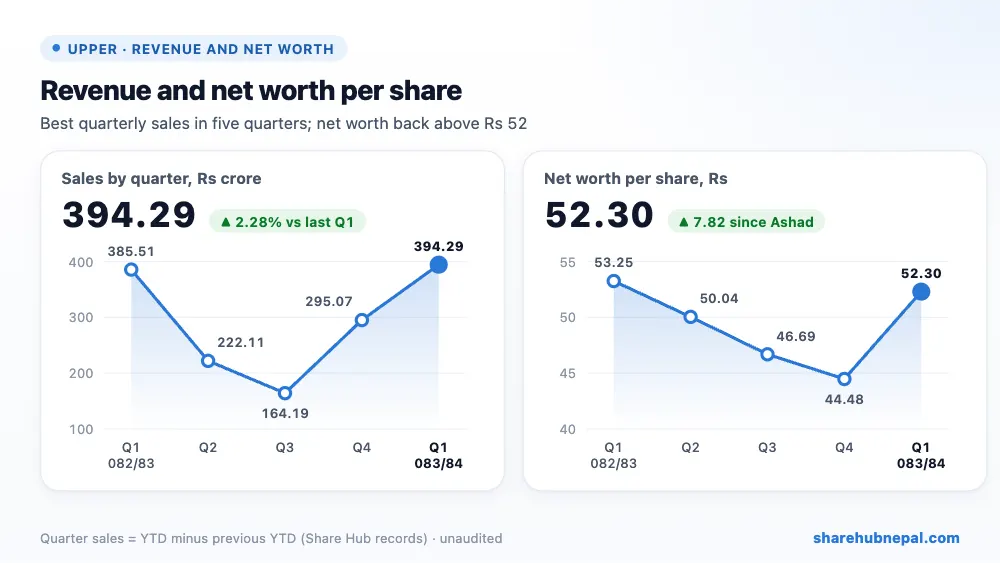
Upper Tamakoshi Hydropower earned a net profit of Rs 165.59 crore in the first quarter of 2083/84, almost the same as last year's Rs 167.47 crore (down 1.12%). Quarter EPS is Rs 7.82 (Rs 7.91 last year), which is Rs 31.27 on an annualised basis, and net worth per share went back up to Rs 52.30 from Rs 44.48 at Ashad end.
Electricity sales grew 2.28% to Rs 3.94 arba and profit from operation rose 3.18% to Rs 2.80 arba, helped by lower royalty and admin cost and no foreign-exchange loss this time. But interest on its Rs 68.42 arba of loans is still the biggest cost: finance cost rose 9.70% to Rs 1.15 arba and took away more than the operating gain.
| Indicator | Q1 2083/84 | Q1 2082/83 | Change |
| Revenue from sale of electricity | Rs 3,942,865,797 | Rs 3,855,149,069 | +2.28% |
| Administrative and project expenses | Rs 120,692,869 | Rs 125,219,518 | −3.61% |
| Royalty | Rs 90,257,316 | Rs 106,358,157 | −15.14% |
| Foreign exchange loss | Rs 0 | Rs 6,258,579 | −100.00% |
| Depreciation | Rs 930,859,304 | Rs 902,578,188 | +3.13% |
| Profit from operation | Rs 2,801,056,308 | Rs 2,714,734,627 | +3.18% |
| Finance and other income | Rs 2,353,808 | Rs 5,951,856 | −60.45% |
| Finance costs | Rs 1,147,472,787 | Rs 1,045,997,482 | +9.70% |
| Net profit | Rs 1,655,937,329 | Rs 1,674,689,000 | −1.12% |
| EPS (annualised) | 31.27 | 31.63 | – |
1. Where the profit came from
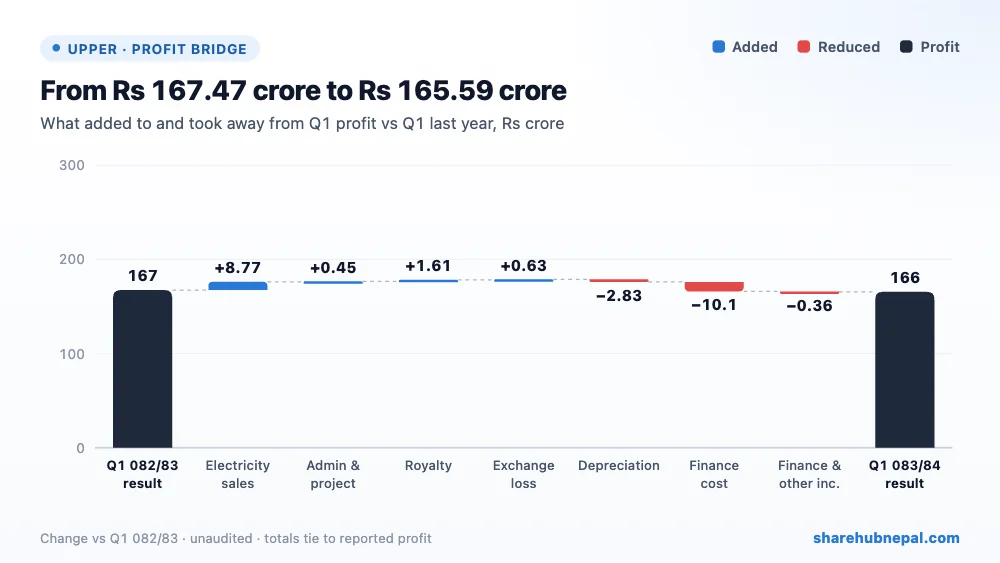
Compared with last year's Q1, higher electricity sales added Rs 8.77 crore, lower royalty Rs 1.61 crore, no exchange loss Rs 62.59 lakh and lower admin and project cost Rs 45.27 lakh. On the other side, higher finance cost took away Rs 10.15 crore, higher depreciation Rs 2.83 crore and lower finance income Rs 35.98 lakh. The net result is Rs 1.88 crore less profit.
2. Profit through the year
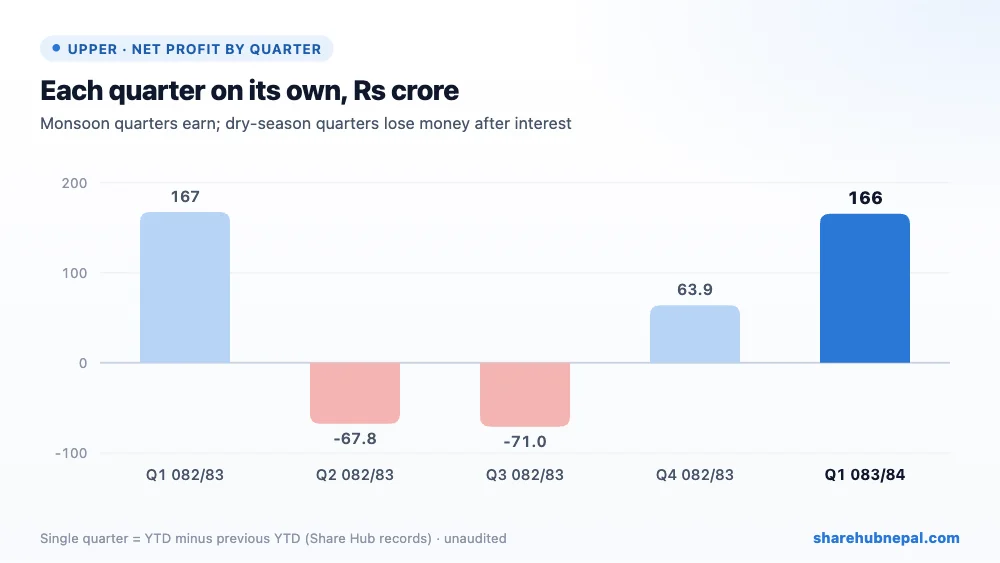
UPPER's profit follows the river. Based on Share Hub's records, single-quarter profit in 2082/83 was Rs 167.47 crore in Q1 (monsoon), a loss of Rs 67.81 crore in Q2 and a loss of Rs 70.98 crore in Q3 (dry season, when sales are low but interest and depreciation stay the same), and Rs 63.92 crore in Q4. FY 2082/83 profit was only Rs 92.59 crore. So a strong Q1 is normal and does not mean the full year will be four times this; the winter quarters usually take a big part of it back.
3. Debt and balance sheet
| Particulars | Ashwin 2083 | Ashad 2083 | Change |
| Property, plant and equipment | Rs 72,003,791,440 | Rs 72,932,031,490 | −1.27% |
| Capital WIP — Rolwaling | Rs 2,552,373,675 | Rs 2,234,346,642 | +14.23% |
| Cash and cash equivalents | Rs 2,056,752,733 | Rs 1,251,523,839 | +64.34% |
| Other current assets | Rs 4,498,971,493 | Rs 4,454,587,497 | +1.00% |
| Long-term loans (incl. current portion) | Rs 68,422,876,580 | Rs 69,241,785,454 | −1.18% |
| Total equity | Rs 11,077,011,312 | Rs 9,421,073,984 | +17.58% |
| Total assets | Rs 81,329,610,638 | Rs 80,943,425,813 | +0.48% |
The balance sheet is heavy with debt. Long-term loans (from the Government via NEA, Nepal Telecom, Citizen Investment Trust and Rastriya Beema) total Rs 68.42 arba against equity of only Rs 11.08 arba, about 6.2 times. Accumulated losses are still Rs 10.98 arba. The good news is that the company is now paying instalments on schedule (it paid the ninth half-yearly Government instalment and the 19th quarterly instalment to other lenders by Ashwin end), loans fell Rs 81.89 crore since Ashad, and lenders agreed to a lower, fixed interest rate from last year's last quarter. Cash rose to Rs 2.06 arba and the liquidity ratio is 1.84.
4. Per-share figures and valuation
| Indicator | Value |
| EPS (quarter, as printed) | Rs 7.82 |
| EPS (annualised) | Rs 31.27 |
| Net worth per share | Rs 52.30 |
| Total assets per share | Rs 383.99 |
| Market price (Q1 close) | Rs 193 |
| P/E (on annualised EPS) | 6.17x |
| P/B | 3.69x |
| Liquidity ratio | 1.84 |
The Q1 closing price was Rs 193 (range Rs 178.90 to Rs 209). On annualised EPS of Rs 31.27 the P/E looks very low at about 6.2 times, but that is misleading because Q1 is the best season; on last year's full-year EPS of Rs 4.37 the P/E is about 44 times. The price is 3.69 times net worth per share. Value depends on how fast the loans come down and whether the lower interest rate lifts winter-quarter results.
Conclusion
Positives: the 456 MW plant is running fully, monsoon sales are at a five-quarter high, royalty and admin cost are lower, loan instalments are being paid on time, lenders have cut and fixed the interest rate, and cash has grown to Rs 2.06 arba.
Watch: finance cost still rising (Rs 1.15 arba in one quarter), loans of 6.2 times equity, Rs 10.98 arba of accumulated losses (no dividend capacity soon), dry-season losses in Q2–Q3, the pending insurance claim for the 2081 landslide damage at the dam site, legal cases (a Supreme Court writ on the main civil contractor's guarantee, and complaints at the Company Registrar), and funding the Rolwaling Khola second-phase project.
A steady monsoon quarter: the plant earns well when water is high, and the company is slowly paying down its huge loan. But interest still eats about 41% of operating profit, so the full-year result will again depend on how much the dry-season quarters lose.
Figures are from the company's unaudited Q1 report; quarter trends use Share Hub records. This is not investment advice.

