













Vision Lumbini Urja Company Ltd. – First Quarter Analysis, FY 2083/84
Unaudited results as on Ashwin end 2083, compared with the same quarter last year (Ashwin end 2082) and with Ashad end 2083.
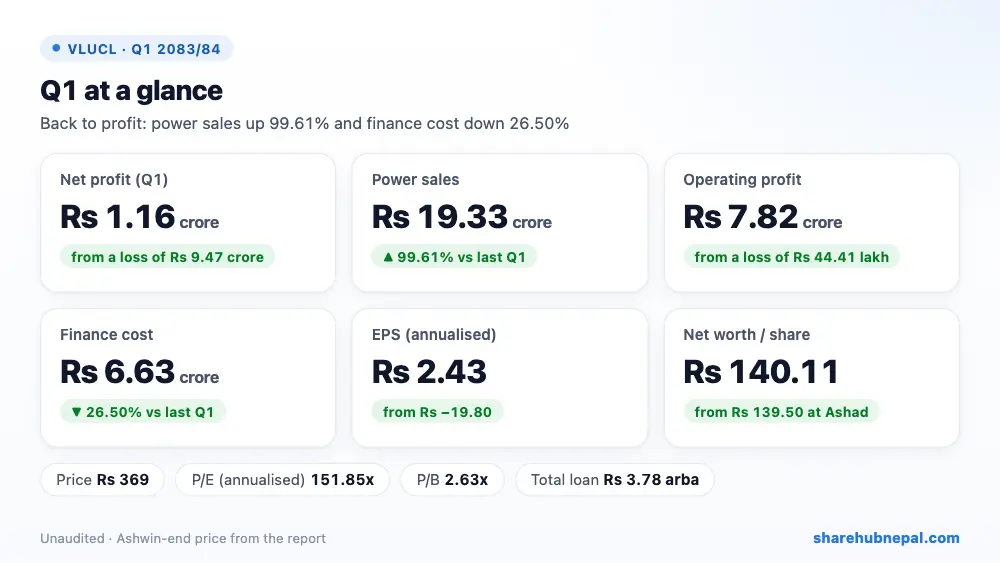
Summary
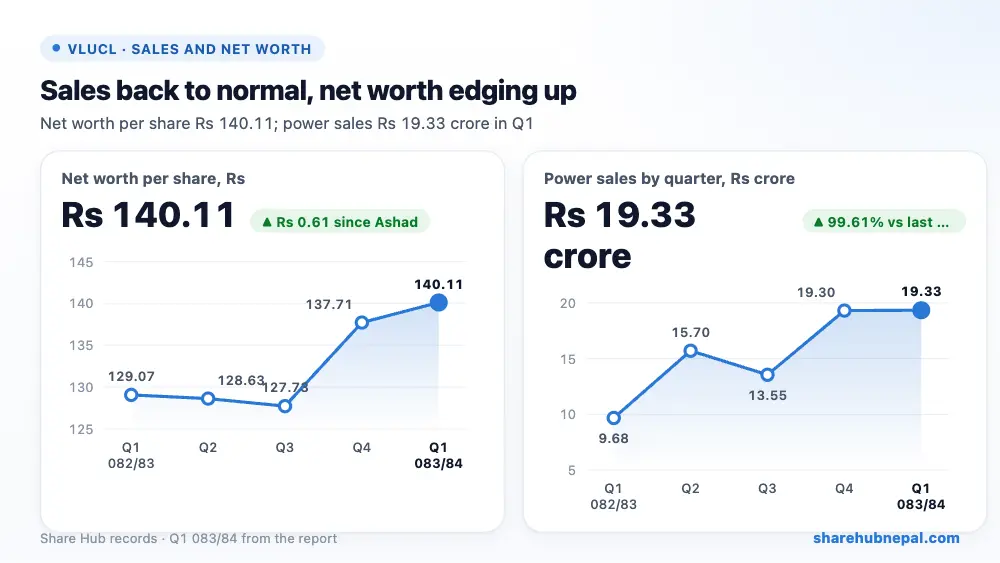
Vision Lumbini Urja earned a net profit of Rs 1.16 crore in the first quarter of FY 2083/84, against a loss of Rs 9.47 crore in the same quarter last year. Power sales doubled (up 99.61%) to Rs 19.33 crore, as last year's Q1 sales of Rs 9.68 crore were unusually low. Finance cost fell 26.50% to Rs 6.63 crore, but depreciation and amortisation of Rs 5.67 crore still takes 29% of sales, so the profit is thin. Annualised EPS is Rs 2.43 and net worth per share is Rs 140.11.
| Indicator | Q1 2083/84 | Q1 2082/83 | Change |
| Revenue from sales | Rs 193,274,585 | Rs 96,825,169 | +99.61% |
| Cost of sales | Rs 48,208,149 | Rs 37,620,900 | +28.14% |
| Other income | Rs 367,073 | Rs 478,967 | −23.36% |
| Operating profit | Rs 78,175,892 | −Rs 4,441,054 | Turned to profit |
| Finance cost | Rs 66,317,092 | Rs 90,222,524 | −26.50% |
| Income tax | Rs 0 | Rs 0 | – |
| Net profit | Rs 11,621,624 | −Rs 94,663,578 | Turned to profit |
| EPS (annualised) | 2.43 | -19.8 | – |
| Net worth per share | 140.11 | 129.07 | – |
1. Where the profit came from
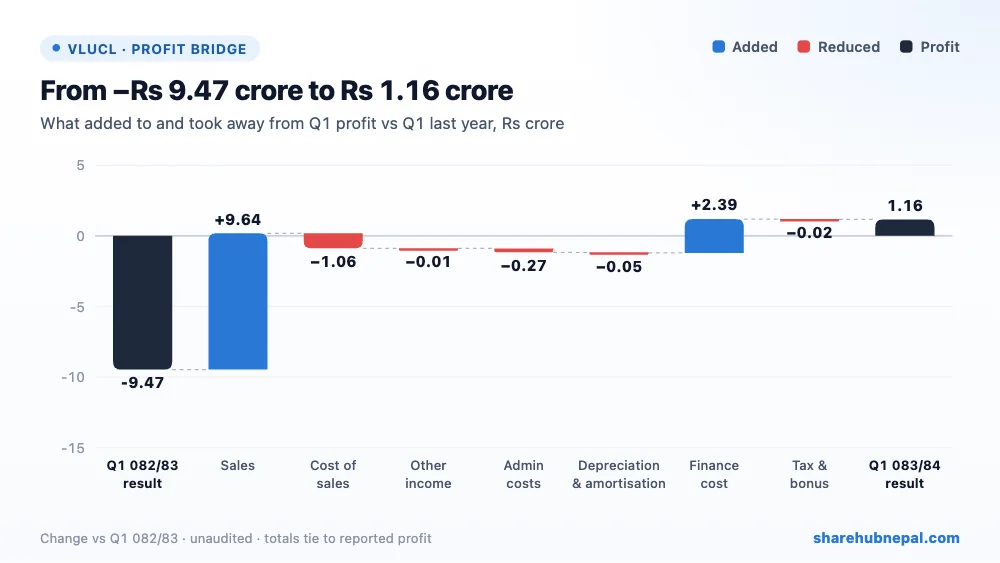
Higher power sales added Rs 9.64 crore to profit and finance cost saved Rs 2.39 crore. Against that, cost of sales rose Rs 1.06 crore, staff and admin costs rose Rs 26.83 lakh and the new staff bonus provision took Rs 2.37 lakh. Depreciation hardly changed. No income tax was charged.
2. Profit through the year
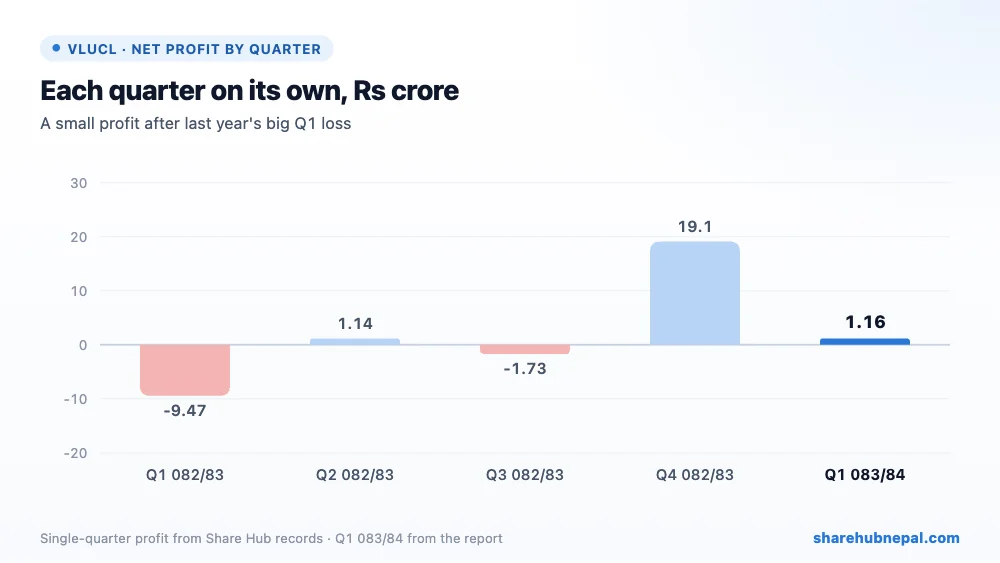
Profit by quarter (Share Hub records): Q1 082/83: −Rs 9.47 crore, Q2 082/83: Rs 1.14 crore, Q3 082/83: −Rs 1.73 crore, Q4 082/83: Rs 19.10 crore, Q1 083/84: Rs 1.16 crore. Share Hub quarter figures are worked out from year-to-date records. FY 2082/83 ended with an audited profit of Rs 12.89 crore (EPS Rs 6.74), helped by other income of Rs 26.80 crore; the Share Hub Q4 record (unaudited) shows Rs 9.05 crore for the year. Without that one-time-looking other income, the plant only just covers its interest and amortisation.
3. Debt and balance sheet
| Particulars | Ashwin 2083 | Ashad 2083 | Change |
| Total assets | Rs 6,578,082,336 | Rs 6,674,629,742 | −1.45% |
| Total equity | Rs 2,679,650,818 | Rs 2,668,029,194 | +0.44% |
| Long-term borrowings | Rs 3,748,981,803 | Rs 3,774,048,886 | −0.66% |
| Current borrowings | Rs 32,250,000 | Rs 107,500,000 | −70.00% |
| Cash and equivalents | Rs 63,489,521 | Rs 288,579,930 | −78.00% |
Total assets fell to Rs 6.58 arba (Rs 343.95 per share), mostly the project intangible of Rs 6.17 arba. Equity rose by exactly the quarter's profit to Rs 2.68 arba (Rs 140.11 per share). Long-term borrowing is Rs 3.75 arba (Rs 4.22 arba a year ago) and current borrowing fell to Rs 3.23 crore from Rs 10.75 crore. Cash dropped from Rs 28.86 crore at Ashad end to Rs 6.35 crore, while other current assets rose to Rs 20.41 crore and receivables to Rs 12.22 crore; the report does not explain these moves. The liquidity ratio is 3.03.
4. Per-share figures and valuation
| Indicator | Value |
| EPS (annualised) | Rs 2.43 |
| Net worth per share | Rs 140.11 |
| Market price (Ashwin end) | Rs 369 |
| P/E (annualised) | 151.85x |
| P/B | 2.63x |
At the Ashwin-end price of Rs 369, the share trades at 151.85 times annualised EPS and 2.63 times net worth per share. That is very expensive: even on last year's audited EPS of Rs 6.74 the P/E is about 55 times, and the return on equity is under 2% a year.
Conclusion
Positives: back to profit, power sales doubled, finance cost down 26.50%, borrowings falling, net worth per share up to Rs 140.11, no income tax.
Watch: profit is thin (Rs 1.16 crore on Rs 19.33 crore of sales), heavy amortisation and Rs 3.75 arba of debt, cash down sharply, last year's profit leaned on other income, very high P/E, monsoon flood and landslide risk named by the company.
A clear recovery from last year's loss, but the margin after interest and amortisation is still small; the dry-season quarters will show whether the company can stay in profit.
Figures are from the company's unaudited Q1 report; quarter trends use Share Hub records. This is not investment advice.

