













Agricultural Development Bank Limited – First Quarter Analysis, FY 2083/84
Unaudited results as on Ashwin end 2083 (bank standalone), compared with the same quarter last year (Ashwin end 2082) and with the year end (Ashad end 2083).
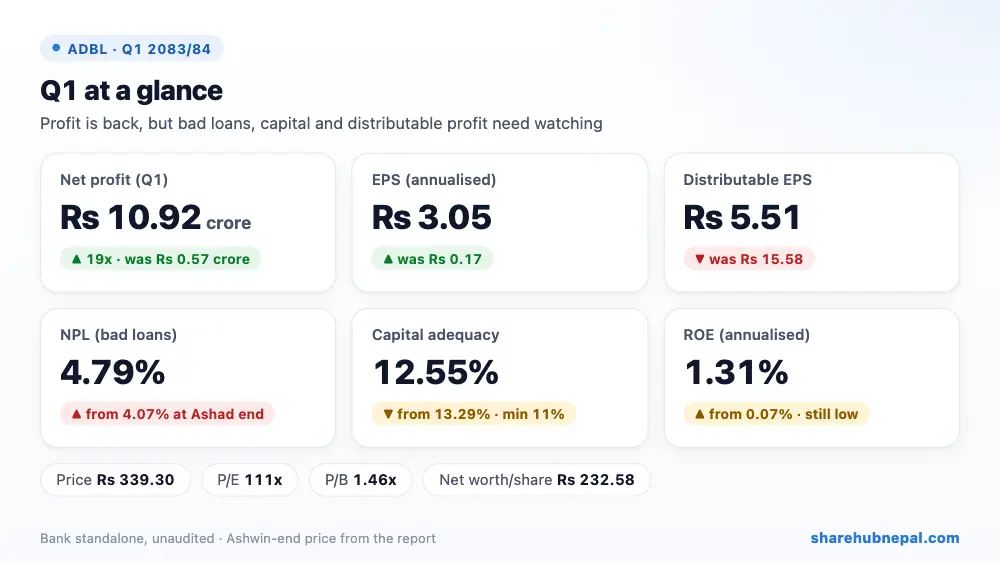
Summary
ADBL earned a net profit of Rs 10.92 crore in the first quarter, against Rs 57.39 lakh in the same quarter last year – about 19 times higher. Annualised earnings per share rose from Rs 0.17 to Rs 3.05.
The recovery is real but narrow. It came mainly from lower loan-loss charges (impairment down 20.80%) and higher fee income (up 55.74%). The bank's core lending business actually earned less: net interest income fell 3.72%. At the same time, bad loans went back up to 4.79%, capital adequacy slipped to 12.55%, and NRB's required deductions left the quarter with a negative Rs 47.42 crore for distribution.
| Indicator | Q1 2083/84 | Q1 2082/83 | Change |
| Net profit | Rs 109,235,421 | Rs 5,738,886 | About 19x |
| Net interest income | Rs 2,362,570,787 | Rs 2,453,734,606 | −3.72% |
| Net fee and commission income | Rs 479,721,246 | Rs 308,025,605 | +55.74% |
| Impairment charge | Rs 1,159,443,305 | Rs 1,463,853,691 | −20.80% |
| Operating profit | Rs 156,039,449 | Rs (63,233,729) | Loss turned to profit |
| EPS (annualised) | Rs 3.05 | Rs 0.17 | Higher |
| Net worth per share | Rs 232.58 | Rs 239.52 | −2.90% |
| NPL | 4.79% | 4.78% | Flat (4.07% at Ashad end) |
| Capital adequacy | 12.55% | 13.63% | Weaker |
| Return on equity (annualised) | 1.31% | 0.07% | Higher, still very low |
1. Where the profit came from
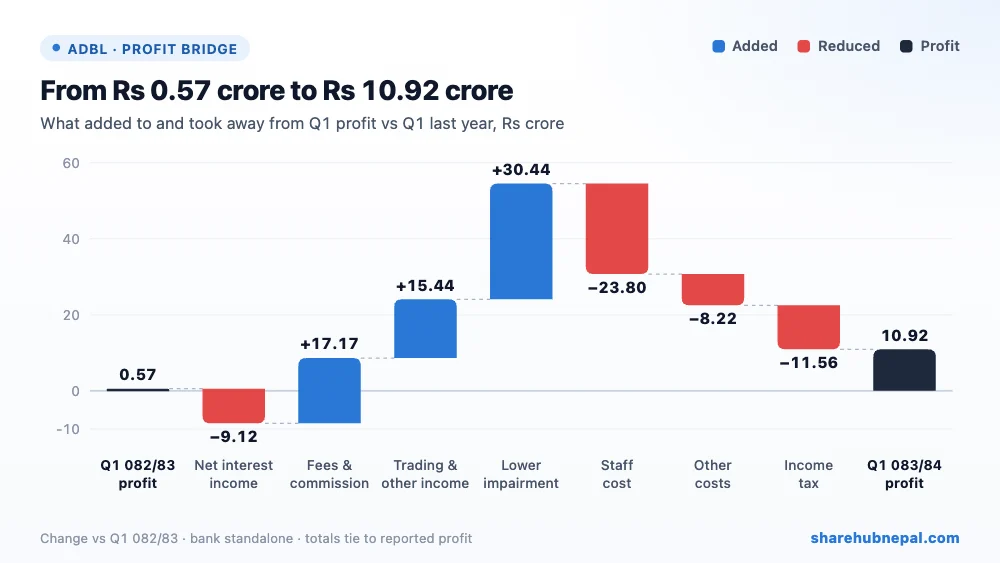
The bridge chart shows how Q1 profit moved from last year's Rs 57.39 lakh to this year's Rs 10.92 crore:
- Lower impairment (+Rs 30.44 crore): the biggest help. The bank set aside Rs 1.16 arba for loan losses, against Rs 1.46 arba last year.
- Fees and commission (+Rs 17.17 crore): net fee income rose 55.74% to Rs 47.97 crore.
- Trading and other income (+Rs 15.44 crore): the trading loss shrank from Rs 16.50 crore to Rs 5.74 crore and other operating income rose 83.67%.
- Net interest income (−Rs 9.12 crore): interest income fell 6.31% while interest expense fell 8.37%. Lower lending rates hurt more than cheaper deposits helped.
- Staff cost (−Rs 23.80 crore): personnel expenses rose 25.48% to Rs 1.17 arba. This figure includes the 5% staff bonus provision.
- Other costs (−Rs 8.22 crore) and income tax (−Rs 11.56 crore): other operating expenses rose 42.91%, and tax was a credit of Rs 6.88 crore last year but a charge of Rs 4.68 crore this year.
In plain terms: the bank earned more because it needed to set aside less for bad loans and because fees grew. Costs grew faster than income: operating costs took 54.4% of operating income, against 47.2% a year ago. Impairment still ate 40.2% of operating income (down from 55.2%), so loan quality remains the main driver of ADBL's profit.
2. Profit through the year
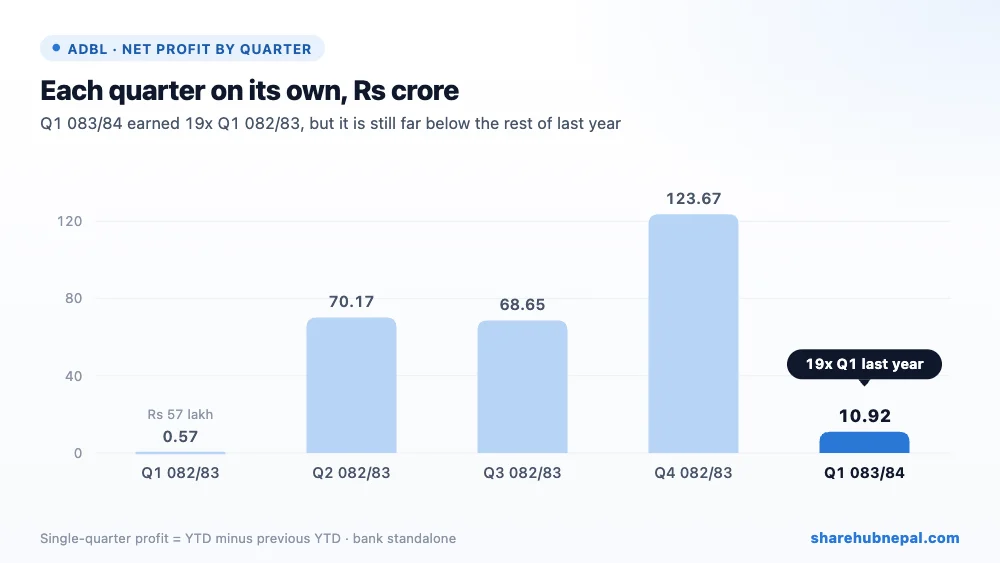
Looking at each quarter on its own, last year's first quarter was tiny (Rs 57.39 lakh), and the bank earned most of its profit later: Rs 70.17 crore in Q2, Rs 68.65 crore in Q3 and Rs 1.24 arba in Q4. This year's Q1 is much better than last year's, but it is still well below those later quarters.
That matters for valuation. The annualised EPS of Rs 3.05 simply multiplies Q1 by four. If the year follows last year's pattern, the full-year figure will be far higher; full-year EPS for 2082/83 was Rs 16.11.
3. Deposits, loans and liquidity
| Particulars | Ashwin 2083 | Ashad 2083 | Change |
| Deposits from customers | Rs 348,277,631,117 | Rs 347,219,869,157 | +0.30% |
| Loans and advances to customers | Rs 250,428,466,682 | Rs 247,145,223,957 | +1.33% |
| Balance with Nepal Rastra Bank | Rs 33,900,589,983 | Rs 18,795,907,519 | +80.36% |
| Investment securities | Rs 99,598,785,145 | Rs 114,523,674,527 | −13.03% |
| Total assets | Rs 420,641,379,207 | Rs 420,134,125,077 | +0.12% |
| Total equity | Rs 38,704,163,551 | Rs 38,906,327,764 | −0.52% |
Business growth was slow in the quarter: deposits grew 0.30% and customer loans 1.33%. The credit-to-deposit ratio is only 67.50%, so ADBL has a lot of room to lend more.
The bigger move was inside the balance sheet. Investment securities fell by Rs 14.92 arba while the balance kept with Nepal Rastra Bank rose by Rs 15.10 arba. The bank is holding a lot of cash-like money: its liquidity ratio is 38.87%.
Funding got cheaper. Cost of funds fell to 2.95% from 3.68% a year ago, and the base rate fell to 4.59% from 5.49%. But lending rates fell even more, so the interest spread narrowed to 3.37% from 3.92%. That is why net interest income fell.
Equity fell 0.52% despite the profit, because of an other comprehensive loss of Rs 31.80 crore.
4. Bad loans and capital – the main cautions
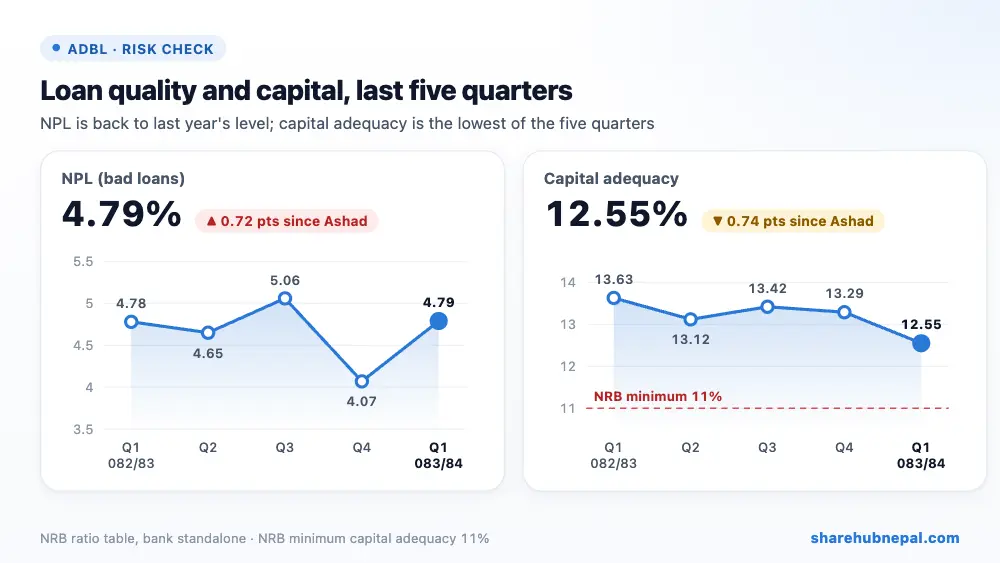
- NPL rose back to 4.79% from 4.07% at Ashad end, the same level as a year ago (4.78%). Loan-loss provisions now cover 102.05% of bad loans, down from 109.66% a year ago, so the cushion is thinner.
- Capital adequacy fell to 12.55% (Tier 1 10.79%, CET1 9.29%), from 13.29% at Ashad end and 13.63% a year ago. It is still above NRB's 11% minimum, but the buffer is now 1.55 points, the thinnest in the last five quarters.
- Legal cases: the bank reports 144 pending court cases where it is plaintiff or defendant.
5. Why distributable profit fell
| Particulars (Rs) | Amount |
| Opening distributable profit (Shrawan 1, 2083) | 1,262,186,665 |
| Add: Q1 net profit | 109,235,421 |
| Less: transfers to reserves and funds | (72,699,160) |
| Less: actuarial loss | (281,340,473) |
| Less: interest receivable not yet collected | (130,039,730) |
| Less: provision on non-banking assets | (54,870,637) |
| Less: ICTL reserve | (44,442,295) |
| Q1 amount available for distribution | (474,156,874) |
| Distributable profit at Ashwin end | 788,029,791 |
NRB rules require banks to deduct some items before profit can be paid out. In this quarter those deductions (Rs 51.07 crore) were far larger than the profit, mainly because of an actuarial loss of Rs 28.13 crore on employee benefits and Rs 13.00 crore of interest income that is booked but not yet received. As a result, distributable profit fell from Rs 1.26 arba to Rs 78.80 crore or Rs 5.51 per share, against Rs 15.58 a year ago.
In plain terms: the bank has made a profit, but very little of it is free to pay as dividend yet. Dividend capacity will depend on the rest of the year.
6. Per-share figures and valuation
ADBL's share capital includes Rs 5.43 arba of irredeemable preference shares. EPS and net worth per share are calculated on the 143,055,191 ordinary shares only.
| Indicator | Value |
| EPS (annualised) | Rs 3.05 |
| Net worth per share | Rs 232.58 |
| Distributable EPS | Rs 5.51 |
| Closing price, Ashwin end 2083 | Rs 339.30 |
| Price range during the quarter | Rs 295.50 – Rs 339.30 |
| P/E on annualised Q1 EPS | 111.2x |
| P/E on full-year 2082/83 EPS (Rs 16.11) | 21.1x |
| Price to book | 1.46x |
The P/E of about 111x looks very high only because Q1 is a weak quarter. On last year's full-year EPS the P/E is about 21x. Return on equity of 1.31% is still very low for a commercial bank.
Conclusion
Positives: profit has recovered strongly from last year's near-zero Q1, impairment charges are lower, fee income grew fast, funding is cheaper and liquidity is ample.
Watch points: core interest income is falling, costs are rising faster than income, NPL is back near 4.8%, the capital buffer is thinner, and distributable profit has shrunk sharply.
For ADBL, the next quarters matter more than this one. Whether loan quality holds and whether the bank can put its spare liquidity to work at decent rates will decide both full-year profit and dividend capacity.
Based on the bank's unaudited first-quarter report. Figures may change after audit or regulator review. This is not investment advice.

